
Soil physical properties under different restoration measures in the northwest of Shanxi Province
-
摘要:目的
晋西北丘陵风沙区由于受风蚀影响,土壤沙化十分严重,生态恢复是缓解此问题的主要措施之一。研究不同土地恢复管理措施旨在为提高晋西北黄土高原丘陵风沙区农田土壤质量及植被恢复提供理论依据。
方法本研究以晋西北五寨县作为研究区,设置4种土地恢复措施:传统翻耕播种玉米 (CTC)、免耕播种玉米 (NTC)、免耕播种苜蓿 (NTA)、撂荒地 (WL)。通过野外和室内分析的方法,分析了0—50 cm土层土壤粒度组成、粒度参数和土壤质量含水量、土壤饱和持水量、毛管持水量。
结果1) 晋西北地区土壤主要以砂粒和粉粒为主。撂荒地砂粒含量最大,且随着深度的增加变化不明显;其它3种措施下的土壤表层砂粒含量均小于深层。不同土地恢复措施间粒度参数差异较大,翻耕分选较差,免耕玉米和免耕苜蓿属于分选中等到分选较好范围,表明翻耕地块土壤受到人为扰动较大,导致土壤偏细,其粉粒含量在0—50 cm土层变化范围为6.5%~15.3%,而免耕苜蓿和免耕玉米土壤环境相对较好。2) 4种土地恢复措施下表层 0—40 cm的土壤容重均低于深层土壤,翻耕、免耕播种玉米和免耕播种苜蓿的土壤容重范围在1.10~1.50 g/cm3之间,表现为WL>NTA>NTC>CTC,撂荒地土壤容重与其它三种处理措施的土壤容重差异显著 (P < 0.05),其他三种措施间差异不显著,40—50 cm土层四种土地恢复措施之间无显著差异;表层 0—30 cm的土壤孔隙度以翻耕总孔隙度最大。翻耕地块土壤孔隙度显著高于其它三种恢复措施,其它三种恢复措施间无显著性差异,40—50 cm土层四种土地恢复措施之间无显著差异。3) 不同土地恢复措施之间土壤质量含水量、饱和持水量和毛管持水量存在较大差异,翻耕地块表层0—20 cm土壤毛管持水量显著高于其它三种恢复措施;免耕苜蓿和免耕玉米地块毛管持水量无显著差异,两者均显著高于撂荒地,20—30 cm土层免耕苜蓿地块显著低于翻耕和撂荒地,30—40 cm土层撂荒地与免耕玉米显著低于翻耕和免耕苜蓿,40—50 cm土层四种土地恢复措施之间无显著差异。4) 土壤毛管持水量和饱和持水量与毛管孔隙度和非毛管孔隙无显著相关关系,与总孔隙度呈显著正相关关系。土壤质量含水量和毛管持水量与粘粒含量无显著相关;与砂粒含量呈极显著负相关,相关系数分别为–0.619和–0.474;与粉粒含量呈显著正相关,相关系数分别为0.639和0.584。
结论晋西北丘陵风沙区翻耕、免耕玉米和免耕苜蓿三种土地恢复措施都不同程度地降低了表层土壤砂粒含量,提高了土壤孔隙度,降低了土壤容重,改善了土壤的保水和供水能力,7年常规耕种和免耕种植作物都显著改善了土壤的物理性状,有助于生态的恢复和提高土壤的生产力。因此,在晋西北地区不提倡土地撂荒。
Abstract:ObjectivesSoil desertification happens widely in the northwest hilly sandy areas of Shanxi Province, China, because of the severe wind erosion in this area. Some land restoration measures were attempted to improve the farmland quality and to provide a theoretical foundation for the vegetation restoration in the study area.
MethodsThe study area was located in Wuzhai County, northwestern Shanxi Province, where the soil was belonged to sand and loam. Four land restoration measures were attempted in separate four plots as: plot reminded uncultivated (WL), plot planted with corn (Zea mays L.) and with no-tillage (NTC), plot planted alfalfa (Medicago sativa L.) and with no-tillage (NTA), plot planted corn and with conventional tillage (CTC). Soil samples were collected after the experiment was conducted for 7 years. The soil particle sizes, particle size parameters, soil water contents, soil saturation moisture capacity and capillary moisture capacity at 0−50 cm soil depths were analyzed.
Results1) The soil was dominated by sand and silt in this area. The sand contents in fields of WL and NTA were higher than those in the other two. The sand contents did not changed obviously with soil depth in WL, while those in 0−20 cm soil layer were significantly lower than further deeper layers in the other three ones. 2) At 0−40 cm soil layer, the soil bulk density was in order of WL>NTA>NTC>CTC. The bulk density in the WL was significantly different from those in the other three ones (P < 0.05). The bulk densities in CTC, NTC and NTA ranged from 1.10 to 1.50 g/cm3, and no significant differences were among them. At 40−50 cm soil layer, the bulk densities were found not significantly different among all the restoration measures. The 0−30 cm soil porosity under the CTC was the highest, which was significantly higher than the other three, and no significant differences were found among the other three measurements. There was no significant difference among all restoration measures at 40−50 cm soil layer. 3) The soil water contents, saturation moisture capacity and maximum water-holing capacity were all significantly different among the measures. The capillary moisture capacity in the 0−20 cm soil layer under CTC was significantly higher than in the other three; no significant differences were found between NTC and NTA, and both were higher than that under CTC. At the 20−30 cm soil layer, the values under NTA were significantly lower than those under CTC and WL, while at the 30−40 cm soil layer, the values under WL and NTC were significantly lower than those under CTC and NTA, and there is no significant difference was found among all restoration measures at 40−50 cm soil layer. 3) The capillary moisture capacity and the saturation moisture capacity were significantly positive correlated with the total capillary porosity, not significant correlated between the capillary porosity and the non-capillary porosity. There were significantly negative correlations between soil water contents and the saturation moisture capacity and the sand contents, and the correlation coefficients were −0.619 and −0.474, respectively, while there were extremely significant positive correlations between soil water contents and the saturation moisture capacity and the silt contents, and the correlation coefficient were 0.639 and 0.584 respectively.
ConclusionsThe soil physical properties have been improved after 7 years plantation in the tested area. Crop planting under both conventional and no-tillage could decrease the top soil sand contents, increase soil porosity, decrease soil bulk density and increase the water supply capacity to plant. Therefore, leave land uncultivated is not recommended for the land restoration of northwest Shanxi Province.
-
土地的不合理利用和开垦造成的不可用耕地面积在不断扩大,这种现象导致了我国山西省西北部黄土高原区域的耕地面积减少和生态环境破坏[1–3]。黄土高原区域气候特征为春季大风,夏季高强度集中降雨,增加了该区沙性易蚀土壤的侵蚀,导致土壤质量的降低,尤其是土壤沙化导致了表层土壤养分的大量流失,影响了农业资源的利用效率。为确保农业可持续发展,保障生态环境安全,当地农民采取不同的土地恢复管理措施利用和开发未开垦的土地[4]。
恢复管理措施涉及不同的作物种类 (如玉米和苜蓿) 和不同的耕作系统 (如常规耕作包括犁耕和耙耕,保护性耕作包括少耕、免耕等)。降低土壤压实、经济适用的作物的轮作以及地表残茬覆盖是保护性耕作的三个核心内容,与传统耕作系统相比,保护性耕作可以降低土壤风蚀、水蚀以及土壤水分蒸发,增加降雨入渗量,提高土壤表层有机碳含量,增强土壤团聚体的数量及稳定性,降低人力及能源输入[5–9]。恢复管理措施的不同对土壤的理化性质会产生不同影响[10–12]。影响土壤理化性质最普遍、最广泛的因素是土地恢复措施,它在很大程度上影响土壤质量变化的程度和方向[13]。不同的土壤类型其土壤质地不同,间接地影响土壤养分和水分的变化。土壤粒度组成是决定土壤理化性质的重要属性特征之一,同时其粒级大小、级配组合、分布状况等受多种因素的影响,包括气候、生物、地形、植被类型以及人类活动等[14–15]。
水分是影响生态系统内诸多生态过程的主要因子,尤其在干旱半干旱地区影响尤为突出[16–17]。本文所选试验地点位于晋西北黄土高原丘陵风沙区,晋西北黄土高原位于我国干旱半干旱地区,生态系统环境脆弱[18–19]。土壤水与地表水、地下水一样,是水资源的一部分,在水资源的形成、转换与利用中起着重要的作用[13]。然而,在干旱半干旱的丘陵风沙区,土壤粒度的特征和组成影响着土壤的抗风蚀能力、土壤持水力和土壤养分状况等[20]。本文通过对晋西北黄土高原丘陵风沙区四种土地恢复措施 (撂荒地、传统翻耕、免耕玉米、免耕苜蓿) 的土壤粒度组成、土壤孔隙度以及土壤含水量、土壤饱和持水量、毛管持水量进行研究及对比分析,以阐明土壤水分和土壤粒度空间分布特征,旨在为提高晋西北黄土高原丘陵风沙区的土壤质量以及植被恢复提供理论依据。
1. 材料与方法
1.1 研究区概况
研究区位于山西省忻州市五寨县胡会乡石咀头村,具体地理位置为111°28′~113°E和38°44′~39°17′N,涵盖华北黄土高原的半干旱区和沙区。该地区属于干旱的大陆性气候,昼夜温差大,年平均气温5.0℃左右,在1月最冷 (–13℃),7月最热 (20℃),年平均太阳辐射2870 h,无霜期120天左右。该地区年平均降水量在450~500 mm之间,降水集中在七月和八月,约占年降水量的44%。根据中国土壤分类系统,研究区土壤为沙黄土,与土壤分类学 (土壤调查) 中认为典型旱成土相似,土壤质地松散,孔隙度高,渗透性好,通气性强,肥力低,土壤有机质含量低[21]。
1.2 研究方法
1.2.1 样地选择及概况
试验从2008年至2015年于山西省忻州市五寨县石咀头村连续进行了7年。2008年4月中旬,选取50年未受干扰的土地长100 m、宽80 m,将其等分为四块,分别免耕种植紫花苜蓿 (NTA)、常规耕作下种植玉米 (CTC)、免耕种植玉米 (NTC)、保持撂荒 (WL)。
1.2.2 土壤样品采集和粒度测定
2015年8月下旬,于每个样地选取10 m × 10 m 样方进行取样。按照采样技术规范挖掘土壤剖面,每个土壤剖面的深度均为50 cm,从上至下每10 cm等间距取样,每个样品取样重量200~300 g。将同一土地恢复措施下的土壤样品混合均匀后风干,过2 mm筛,去除根系等杂质。称取土样0.8 g,加30% 过氧化氢,去除有机质,加盐酸去除碳酸盐。加超纯水反复稀释静置,除去上清液以除酸,直至pH值为6.5~7.0。加入六偏磷酸钠,超声震荡30 s,利用Mastersizer3000激光粒度仪测量土壤粒径的体积分数。每样品重复3次。采用国际土壤质地分类标准:砂粒20~2000 μm,粉粒 2~20 μm,粘粒< 2 μm。根据Folk和Ward提出的公式,使用GRADISTAT粒度处理软件计算平均粒径、标准偏差、偏度、峰度等粒度参数[22–23]。
1.2.3 土壤水分及主要物理性状参数测定
土壤含水量采用传统烘干法进行测定[24];采用环刀法测定土壤容重,环刀浸水法测定土壤饱和持水量和毛管持水量[24-25]。每个样品重复三次测量。
土壤总孔隙度 = 土壤饱和持水量 × 土壤容重
毛管孔隙度 = 毛管最大持水量 × 土壤容重
非毛管孔隙度 = 总孔隙度 − 毛管孔隙度
1.3 数据处理
采用Excel进行数据处理,采用SPSS13.0软件进行数据统计分析,图形的绘制通过Sigmaplot13.0软件完成。
2. 结果与分析
2.1 土壤粒度分析
2.1.1 土壤颗粒组成总体特征
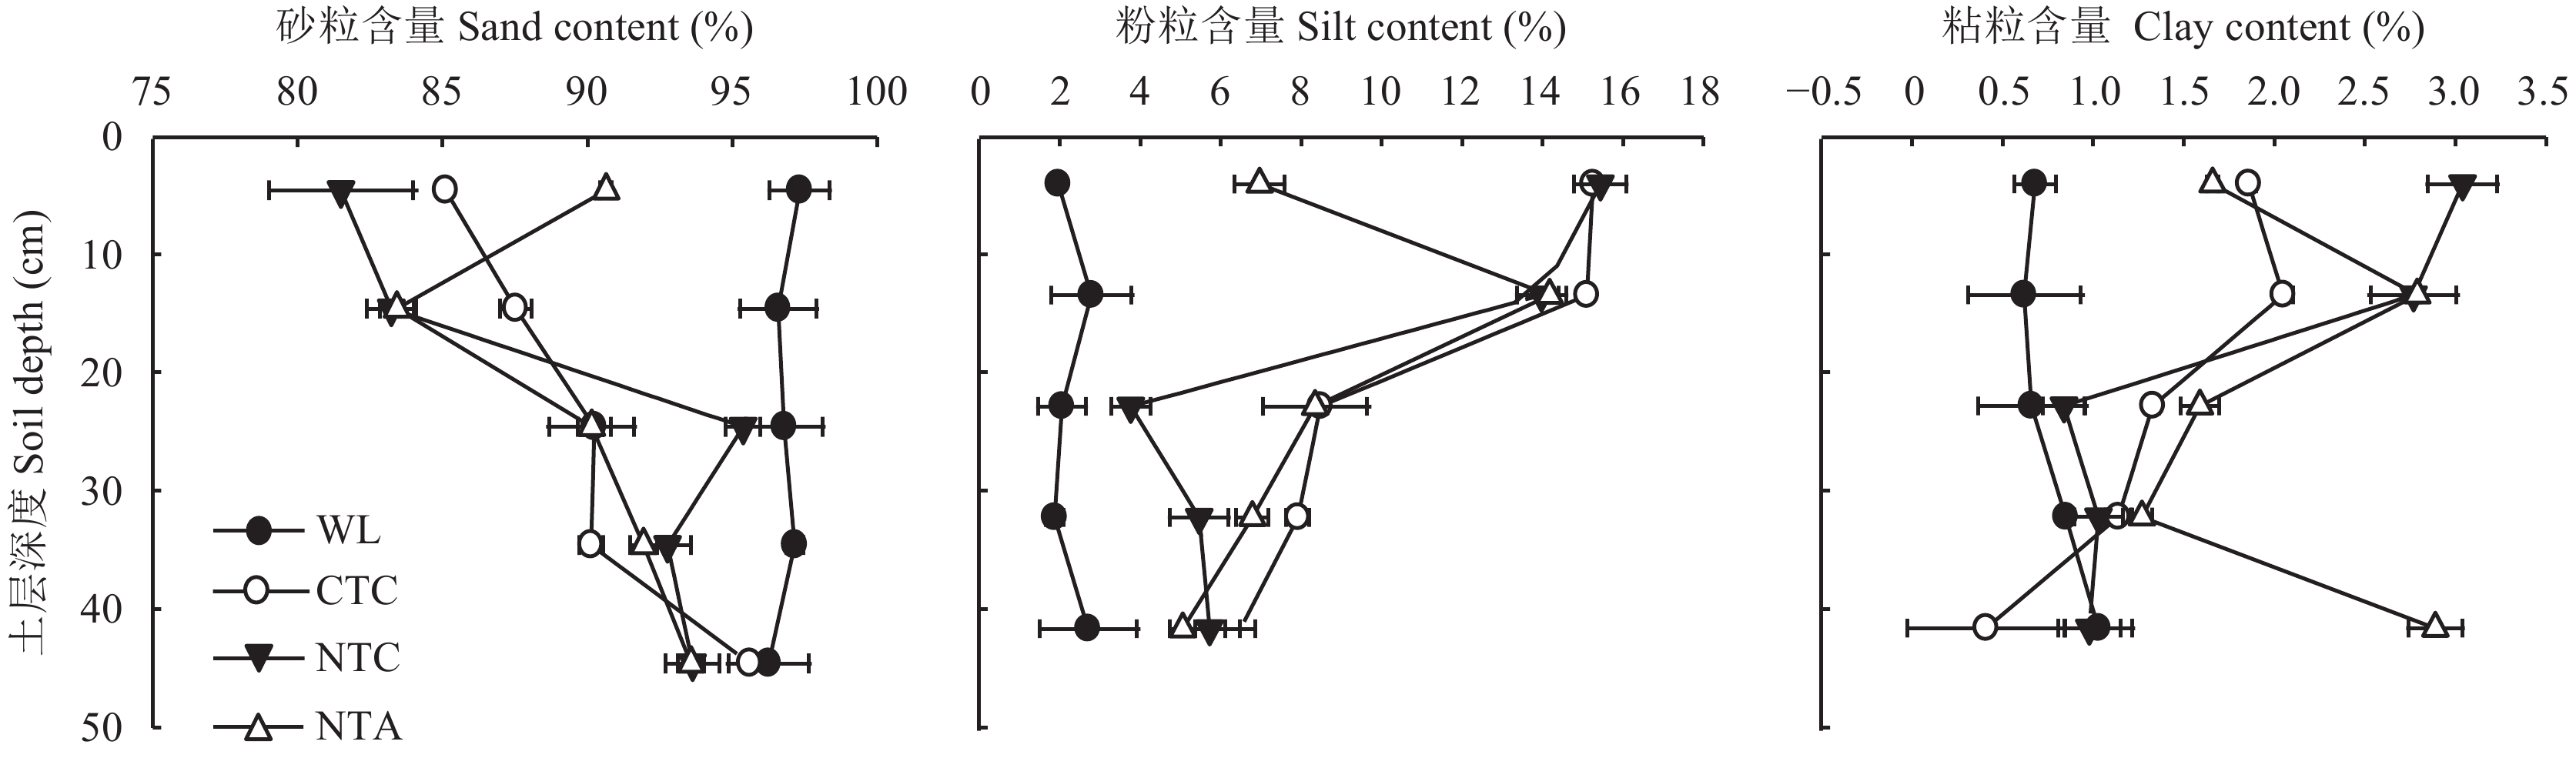
由图1可以得出,从上往下,撂荒地砂粒含量为96.3%~97.3%,在整个土层深度上下变化幅度不明显。翻耕地块砂粒含量为85.1%~95.6%,免耕玉米地块为81.5%~95.4%,免耕苜蓿地块为83.4%~93.5%,三种土地恢复措施的砂粒含量表现为深层显著高于表层。表层土壤 (0—20 cm) 中砂粒含量在不同的土地恢复措施下变化趋势为撂荒地>免耕苜蓿>翻耕>免耕玉米。在整个土层深度,粉粒含量撂荒地变化范围为1.8%~2.8%,翻耕地块为6.5%~15.3%,免耕玉米地块为3.8%~15.4%,免耕苜蓿地块为5.1%~14.2%。表层土壤 (0—20 cm) 粉粒含量在不同的土地恢复措施下变化趋势为翻耕>免耕玉米>免耕苜蓿>撂荒地。
对同一深度不同土地恢复措施下土壤砂粒和粉粒含量进行方差分析,撂荒地砂粒含量显著高于其它几种土地恢复措施,而翻耕与免耕玉米措施下无显著差异 (P < 0.05)。在20—40 cm土层,撂荒地和免耕玉米砂粒含量最大;40—50 cm 土层,四种土地恢复措施砂粒含量无显著差异。表层 (0—20 cm)粉粒含量表现为撂荒地<免耕苜蓿<翻耕<免耕玉米,其中撂荒地粉粒含量最小,与其它三种存在显著差异,而翻耕、免耕玉米、免耕苜蓿措施之间无显著差异。
![]() 图 1 不同土地恢复措施下剖面土壤粒度变化[注(Note):WL—撂荒地Uncultivated field; CTC—传统翻耕 Conventional tillage; NTC—免耕种植玉米 No-tillage corn; NTA—免耕种植苜蓿 No-tillage alfalfa.]Figure 1. Changes of soil particle sizes under different land restoration measures
图 1 不同土地恢复措施下剖面土壤粒度变化[注(Note):WL—撂荒地Uncultivated field; CTC—传统翻耕 Conventional tillage; NTC—免耕种植玉米 No-tillage corn; NTA—免耕种植苜蓿 No-tillage alfalfa.]Figure 1. Changes of soil particle sizes under different land restoration measures2.1.2 土壤粒度组成参数特征
根据Folk和Ward提出的粒度参数分级标准[26],探讨不同土地恢复措施下土壤粒度参数特征。表1中平均粒径代表粒度的集中趋势,平均粒径变化范围介于3.55~4.53 Φ之间;中值粒径变化范围在3.46~4.26 Φ之间;免耕玉米和翻耕地块随着深度的增加逐渐减小,撂荒地和免耕苜蓿地块基本保持不变。如果粒级少,主要粒径突出,百分含量高,分选好,那么标准偏差和分选系数的数值就小,分选系数常被用作环境指标来表明土壤环境的优劣[20]。对比分选系数评价标准,四种土地恢复措施的分选性表现出显著差异 (P < 0.05),免耕玉米属于分选中等到分选较好范围;撂荒地分选较好;免耕苜蓿分选中等;翻耕分选较差 (表1)。偏度用来反映粒度分布的不对称程度。翻耕和免耕苜蓿的偏度范围为0.22~0.40 Φ,而翻耕地块大部分数值属于极正偏,免耕苜蓿地块为正偏;撂荒地偏度范围为 –0.04~–0.12 Φ,属于近对称;免耕玉米地块的偏度范围为0.08~0.34 Φ之间,其偏度范围比较广。峰度是用来表示粒度频率曲线尖锐程度的参数,四种土地恢复措施的峰度数值的变化无显著差异 (P > 0.05),数值大于1.0,集中在极尖窄范围。
表 1 不同土地恢复措施土壤粒度参数特征Table 1. Characteristics of soil particle size parameters under different restoration measures恢复措施
Restoration measure土层深度 (cm)
Soil depth平均粒径 (Φ)
Mean中值粒径 (Φ)
Median分选系数 (Φ)
Sorting coefficient偏度 (Φ)
Skewness峰度 (Φ)
Kurtosis撂荒地
Uncultivated land0—10 3.55 3.54 0.57 –0.04 1.01 10—20 3.58 3.57 0.59 –0.05 1.03 20—30 3.57 3.56 0.63 –0.11 1.23 30—40 3.55 3.54 0.55 –0.04 1.02 40—50 3.55 3.54 0.64 –0.12 1.29 传统翻耕
Conventional tillage0—10 4.50 4.24 1.52 0.37 1.59 10—20 4.53 4.26 1.50 0.40 1.55 20—30 4.01 3.91 1.08 0.32 1.58 30—40 3.89 3.82 1.02 0.22 1.41 40—50 3.64 3.46 1.11 0.30 1.30 免耕玉米
No-tillage corn0—10 4.40 4.17 1.47 0.34 1.48 10—20 4.29 4.03 1.58 0.32 1.57 20—30 3.60 3.59 0.77 0.08 1.26 30—40 3.70 3.66 0.95 0.24 1.58 40—50 3.77 3.73 0.90 0.18 1.38 免耕苜蓿
No-tillage alfalfa0—10 3.74 3.69 1.01 0.29 1.72 10—20 4.26 3.98 1.43 0.40 1.55 20—30 3.87 3.78 1.07 0.28 1.60 30—40 3.78 3.73 0.98 0.26 1.57 40—50 3.77 3.74 0.89 0.26 1.63 2.2 土壤容重和孔隙度
土壤容重是土壤紧实度的敏感性指标,也是表征土壤质量的重要参数。从表2可以看出,随着土层深度的增加,四种土地恢复措施的土壤容重逐渐增加。对同一土层,不同土地恢复措施之间土壤容重进行方差分析,在0—20 cm土层,撂荒地最大,且与免耕玉米之间无显著差异。在20—40 cm土层以撂荒地土壤容重最大,与其它三种土地恢复措施之间存在显著差异。40—50 cm四种土地恢复措施之间无显著差异。
土壤孔隙包括毛管孔隙度和非毛管孔隙度,其孔隙组成直接影响土壤的通气性和透水能力。由表2可以看出,在同一土地恢复措施中,随着土层深度的增加,土壤总孔隙度基本呈逐渐减小的趋势。在同一土层对四种土地恢复措施的总孔隙度、毛管孔隙度和非毛管孔隙度进行分析,发现在0—30 cm土层翻耕处理总孔隙度最大,且与其它三种土地恢复措施存在显著差异。30—40 cm土层免耕苜蓿和翻耕措施下总孔隙度最大,且与免耕玉米和撂荒地之间存在显著差异;40—50 cm土层四种土地恢复措施之间无显著差异。对于毛管孔隙度,0—20 cm土层免耕玉米最小,且与其它三种土地恢复措施存在显著差异;而20—50 cm土层四者之间无显著差异。非毛管孔隙度则与毛管孔隙度规律相反。10—20 cm土层非毛管孔隙度以撂荒地最小,且与其它三种土地恢复措施之间存在显著差异。20—40 cm土层免耕苜蓿显著小于其它三种处理。40—50 cm土层四者之间无显著差异。
表 2 不同土地恢复措施土壤容重和孔隙度Table 2. Soil bulk density and porosity under different restoration measures恢复措施
Restoration measure土层深度 (cm)
Soil depth容重 (g/cm3)
Bulk density非毛管孔隙度 (%)
Non-capillary porosity毛管孔隙度 (%)
Capillary porosity总孔隙度 (%)
Total porosity撂荒地
Uncultivated land0—10 1.44 ± 0.04 a 3.43 ± 0.19 b 44.07 ± 0.80 a 47.50 ± 0.92 b 10—20 1.45 ± 0.02 a 1.47 ± 0.07 b 43.86 ± 0.67 a 45.33 ± 0.72 b 20—30 1.51 ± 0.02 a 1.73 ± 0.20 c 42.77 ± 1.65 b 44.50 ± 1.81 b 30—40 1.48 ± 0.03 a 2.20 ± 0.29 b 42.13 ± 0.17 b 44.33 ± 0.38 bc 40—50 1.44 ± 0.05 a 1.40 ± 0.21 c 40.76 ± 2.37 ab 42.16 ± 2.52 b 传统翻耕
Conventional tillage0—10 1.10 ± 0.02 c 6.97 ± 0.23 b 47.71 ± 0.25 a 54.68 ± 0.35 a 10—20 1.19 ± 0.03 c 5.73 ± 0.41 b 44.36 ± 0.77 a 50.09 ± 1.16 a 20—30 1.38 ± 0.01 b 3.10 ± 0.20 a 46.13 ± 0.70 a 49.23 ± 0.85 a 30—40 1.39 ± 0.01 b 2.27 ± 0.18 b 46.80 ± 0.38 a 49.06 ± 0.50 a 40—50 1.5 ± 0.01 a 1.80 ± 0.12 c 44.78 ± 0.43 a 46.58 ± 0.54 a 免耕玉米
No-tillage corn0—10 1.37 ± 0.01 ab 24.9 ± 6.30 a 22.27 ± 6.75 b 47.17 ± 0.46 b 10—20 1.37 ± 0.01 b 13.5 ± 2.66 a 32.98 ± 2.17 b 46.48 ± 0.49 b 20—30 1.41 ± 0.01 b 2.53 ± 0.07 b 42.00 ± 0.75 b 44.53 ± 0.68 b 30—40 1.42 ± 0.01 b 4.13 ± 0.54 a 39.39 ± 0.64 c 43.52 ± 0.35 c 40—50 1.45 ± 0.03 a 3.55 ± 0.03 a 44.15 ± 0.26 a 47.70 ± 0.23 a 免耕苜蓿
No-tillage alfalfa0—10 1.36 ± 0.02 b 2.93 ± 0.68 b 46.34 ± 0.23 a 49.27 ± 0.87 b 10—20 1.39 ± 0.02 ab 3.40 ± 0.10 b 44.00 ± 0.26 a 47.4 ± 0.36 b 20—30 1.41 ± 0.01 b 1.70 ± 0.12 c 44.60 ± 0.63 ab 46.30 ± 0.75 ab 30—40 1.47 ± 0.01 b 1.90 ± 0.28 b 43.40 ± 0.48 b 45.20 ± 0.23 b 40—50 1.47 ± 0.01 a 2.67 ± 0.26 b 37.82 ± 0.57 b 40.48 ± 0.44 b 注(Note):数据后不同字母表示在同一土层深度不同恢复措施间差异达到显著水平 (P < 0.05) Values followed different letters indicate significantly differences among restoration measures in the same sampling soil depth (P < 0.05) 2.3 土壤水分变化分析
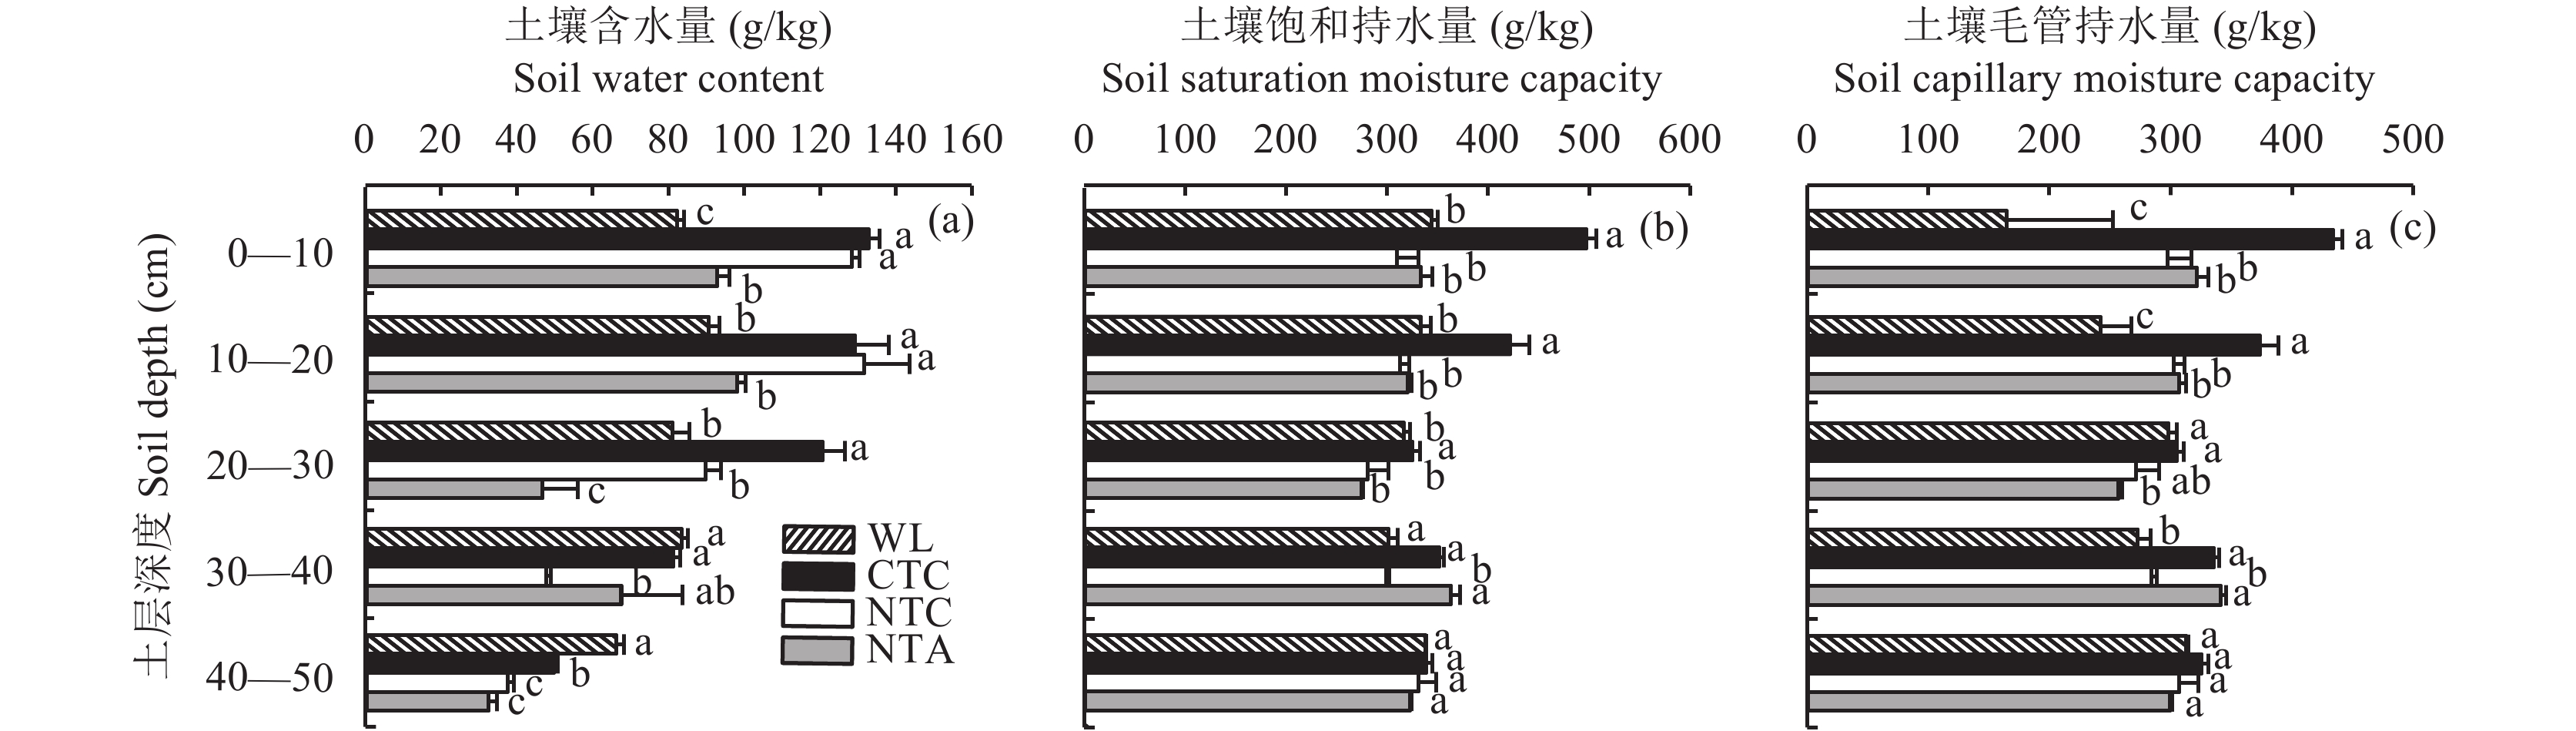
不同土地恢复措施下土壤含水量、饱和持水量和毛管持水量均呈显著性差异 (P < 0.05)。通过对土壤剖面土壤水分的空间变化特征分析, 发现四种土地恢复措施土壤含水量都随着深度的增加而减少。图2a显示,撂荒地土壤含水量随着深度的增加变化不明显;翻耕、免耕玉米和免耕苜蓿地块土壤水分在0—20 cm土层变化不明显,在20—50 cm土层逐渐减少。在土壤表层0—20 cm撂荒地和免耕苜蓿的土壤含水量无显著差异;翻耕和免耕玉米措施下也无显著差异。在20—30 cm土层翻耕地块土壤水分含量显著高于其它三种土地恢复措施,撂荒地和免耕玉米措施之间无明显变化,免耕苜蓿地块水分含量最低。在30—40 cm土层免耕玉米措施下土壤水分含量最低,而其它三种土地恢复措施的土壤水分含量无显著差异。在40—50 cm土层免耕玉米和免耕苜蓿地块的土壤水分含量无明显变化。
对土壤饱和持水量进行方差分析,发现在0—30 cm土层翻耕最大,且与其它三种土地恢复措施存在显著差异;在30—40 cm土层免耕玉米最小,与其它三种土地恢复措施之间存在显著差异;而40—50 cm土层四种土地恢复措施之间无明显变化。在同一土地恢复措施中,随着土层深度的增加,撂荒地无明显变化,而翻耕和免耕玉米深层土壤饱和含水量小于表层土壤,免耕苜蓿地块深层土壤饱和含水量大于表层 (图2 b)。
在0—20 cm土层土壤毛管持水量表现为:翻耕 > 免耕苜蓿 > 免耕玉米 > 撂荒地,翻耕和撂荒地均与其它两种土地恢复措施之间存在显著差异,免耕玉米和免耕苜蓿措施之间无显著差异。在20—30 cm土层免耕苜蓿地块土壤毛管持水量显著低于翻耕和撂荒地的。在30—40 cm土层撂荒地与免耕玉米土壤毛管持水量显著低于翻耕和免耕苜蓿的。在40—50 cm土层四种土地恢复措施之间无显著差异。在同一土地恢复措施下,随着土层深度的增加,撂荒地毛管持水量逐渐增加,与撂荒地相比,翻耕、免耕玉米和免耕苜蓿地块表层土壤毛管持水量大于深层土壤毛管持水量 (图2 c)。
![]() 图 2 不同土地恢复措施土壤含水量变化[注(Note):WL—撂荒地Uncultivated field; CTC—传统翻耕 Conventional tillage; NTC—免耕种植玉米 No-tillage corn; NTA—免耕种植苜蓿 No-tillage alfalfa. 柱旁不同字母表示同一土层深度不同恢复措施间差异达到显著水平Different small letters by the bars indicate significantly different among the restoration measures for the same soil depth (P < 0.05).]Figure 2. Changes of soil water contents under different restoration measures
图 2 不同土地恢复措施土壤含水量变化[注(Note):WL—撂荒地Uncultivated field; CTC—传统翻耕 Conventional tillage; NTC—免耕种植玉米 No-tillage corn; NTA—免耕种植苜蓿 No-tillage alfalfa. 柱旁不同字母表示同一土层深度不同恢复措施间差异达到显著水平Different small letters by the bars indicate significantly different among the restoration measures for the same soil depth (P < 0.05).]Figure 2. Changes of soil water contents under different restoration measures2.4 土壤粒度与含水量相关性分析
表3结果表明,容重与砂粒含量呈显著正相关,与粉粒含量呈显著负相关 (P < 0.05)。非毛管孔隙度与砂粒含量呈显著负相关,而与粉粒和粘粒含量呈显著正相关。总孔隙度与粉粒含量呈正相关。由于该地区土壤砂粒含量所占比例最大,因土壤容重是指单位容积原状土壤干土的质量[27],因此两者呈显著正相关。而孔隙的组成影响着土壤的通气性以及根系的穿插及土壤的蓄水能力[28],而粉粒和粘粒粒径较小,有较强的保水性。
土壤质量含水量和毛管持水量与砂粒呈负相关,与粉粒呈正相关。饱和持水量与砂粒、粉粒和粘粒无显著相关性。这说明土壤含水量与机械组成有很强的相关性。这是由于砂质土壤颗粒粗,土地松散,而且主要集中于深层土壤中,由于人为活动主要干扰表层土壤,苜蓿根系较深,对深层土壤水分的吸收,再加上人为活动的干扰,因此砂质土壤储水能力弱。粘质土壤主要集中在表层,受到人为活动的干扰较大,因此水分储存能力强。
表 3 土壤粒度、物理特征和含水量间的相关性分析Table 3. Correlation analysis of soil particle size, physical characteristics and water contents项目Item 砂粒Sand 粉粒Silt 粘粒Clay BD N-CP CP TP SWC SMC CMC 砂粒Sand 1 粉粒Silt –0.959** 1 粘粒Clay –0.829** –0.754** 1 BD 0.517* –0.677** –0.291 1 N-CP –0.679** 0.617** 0.628* –0.287 1 CP 0.443 –0.323 –0.428* –0.124 –0.848** 1 TP –0.385 0.497* 0.249 –0.736** 0.209 0.342 1 SWC –0.619** 0.639* 0.387 –0.515* 0.505* –0.250 0.434 1 SMC –0.265 0.435 0.086 –0.861** 0.022 0.432 0.836** 0.415 1 CMC –0.474** 0.584* 0.292 –0.722** 0.15 0.264 0.751** 0.312 0.695** 1 注(Note):BD—土壤容重 Bulk density;N-CP—非毛管孔隙度 Non-capillary porosity;CP—毛管孔隙度 Capillary porosity;TP—总孔隙度 Total porosity;SWC—土壤含水量 Soil water content;SMC—饱和持水量 Saturated moisture capacity;CMC—毛管持水量 Capillary moisture capacity. *—P < 0.05;**—P < 0.01. 3. 讨论
3.1 晋西北丘陵风沙区土壤粒度组成
相同区域,相同生境内,土壤粒度组成不仅与土地恢复措施有关外,还与不同的植被类型有一定的关系。不同的土地恢复措施,包括人类耕作的大幅度活动都会影响土壤的粒度组成[29]。农作物以及植被通过地表的覆盖及枯落物形成的腐殖质,再加上植物根系本身的穿插能力都可以改变土壤的物理性质和化学性质,从而影响土壤的颗粒组成。晋西北丘陵风沙区四种土地恢复措施,主要粒度组成为砂粒,可见晋西北丘陵风沙区的颗粒组成较粗。对比分析可知,撂荒地的砂粒含量最大,并且撂荒地的砂粒含量随着深度的增加变化不明显,而其它三种恢复方式下,表层土壤砂粒含量低于深层土壤。这是由于撂荒地地表植被覆盖较少,而其它三种恢复方式的地表都有大量植被覆盖,减小了风蚀带走表土中细小黏粒的可能,此外,免耕玉米由于农作物枯落物的覆盖以及腐殖质的形成,导致表层土壤的物理性质和化学性质发生改变,也可能使土壤的微生物群落结构发生变化,因此表层土壤颗粒组成小于深层土壤。土壤颗粒频繁受到扰动,有利于颗粒圆化和细化[30–31],因此土壤粒度会趋向于正偏。本文中,撂荒地分选较好,免耕玉米属于分选中等到分选较好范围,免耕苜蓿分选中等,翻耕分选较差;撂荒地偏度属于近对称,而翻耕属于极正偏,免耕苜蓿地块土壤粒度在正偏范围,表明翻耕地块土壤偏细,可能是翻耕地块土壤受到人为扰动较大所致。
3.2 晋西北丘陵风沙区土壤粒度与土壤物理参数的关系
晋西北丘陵风沙区翻耕、免耕玉米和免耕苜蓿的容重范围在1.10~1.50 g/cm3 之间,在同一深度下均低于撂荒地;总孔隙度为40.48%~54.68%,表明晋西北丘陵风沙区土壤的物理性质得到很好地改善。翻耕和免耕玉米总孔隙度最大,达到54%,表层 0—20 cm的土壤容重均低于深层土壤,这不仅是由于耕作对土壤的影响,还与表层枯落物的覆盖以及腐殖质的形成有关,这是由于表层物的覆盖减弱了降雨的冲刷以及风力对土壤的影响,免耕苜蓿地的根系使得土壤的总孔隙度增大,因此改善了土壤的物理性质[32–33]。尤为等[34]的研究说明施肥有助于土壤容重的减小和孔隙度的增加,因此施肥也是翻耕和免耕玉米比撂荒地容重小的原因之一。而撂荒地表层容重大,孔隙度低,可能由于撂荒地植被稀少,植物根系稀少,因此对降低土壤容重,增加土壤孔隙度的作用较小,而且地表覆盖度低,加上雨水打击地表,因此增大了土壤容重。
土壤团聚体分形维数越低,土壤的物理性质及肥力越好[35],土壤中粘粒含量越多即土壤越粘重,土壤分形维数就越高[36]。在本研究中,土壤中的颗粒较粗,孔隙度较大,粘粒含量所占比例小,因此土壤分形维数低。且土壤容重与土壤粘粒无显著关系,与毛管孔隙度成正相关关系,说明土壤的孔隙度比较大,通透性好,分形维数比较低,因此土壤的物理性质比较好,这与李民义[37]等的研究结果一致。
3.3 晋西北丘陵风沙区土壤粒度与土壤蓄水能力的关系
土壤是水分蓄积的主要场所,土壤毛管持水量主要反映植物的生理用水,而饱和持水量是毛管持水量与非毛管持水量的总和,可以说明土壤的涵养水分的能力以及土壤抗侵蚀的功能[38–39]。晋西北丘陵风沙区翻耕、免耕苜蓿和免耕玉米地块表层土壤毛管持水量均高于撂荒地,因此,从植物对水分的利用能力方面来看,翻耕、免耕苜蓿和免耕玉米恢复措施对植物的供水能力较好。在0—30 cm,翻耕地块土壤饱和含水量显著高于其它三种恢复措施,这是由于翻耕耕作在播种前对耕层土壤进行了翻耕,增大了表层土壤孔隙度,从而提高了土壤表层蓄水能力。在同一土地恢复措施中,随着土层深度的增加,撂荒地饱和含水量无明显变化,而翻耕和免耕玉米深层土壤饱和含水量小于表层土壤,由于翻耕地块的耕作以及免耕玉米地块的秸秆覆盖,此外,施肥也提高了表层土壤孔隙度,使得饱和含水量在表层高于深层土壤。而免耕苜蓿地深层土壤饱和含水量大,说明免耕苜蓿地在集中降雨时期,土壤总蓄水能力高,水土保持能力较好。
土壤的物理性质是反映水土保持的一种指标,毛管持水量和饱和持水量与总毛管孔隙度呈显著正相关关系,与毛管孔隙度和非毛管孔隙无明显相关关系。这说明土壤孔隙度大小的分布决定着土壤的持水性能[40]。另外,在本研究中毛管持水量与粘粒含量无明显的相关性,与砂粒含量显著负相关,与粉粒含量呈显著正相关。这说明土壤的颗粒组成在一定程度上会影响植物对水分的利用能力。
4. 结论
晋西北丘陵风沙区土壤粒度组成主要为砂粒,该区土壤颗粒组成较粗,且表层土壤颗粒组成小于深层土壤。与撂荒地相比,而其它三种土地恢复措施都降低了表层土壤砂粒的含量,改善了表层土壤的质量。同时,翻耕耕作、免耕玉米和免耕苜蓿三种土地恢复措施可提高土壤孔隙度,降低土壤容重,改善了该区土壤的物理性质。此外,土壤的颗粒组成在一定程度上会影响植物对水分的利用能力,翻耕耕作、免耕玉米和免耕苜蓿对植物的供水能力较好,且免耕苜蓿地在集中降雨时期,具有较好的土壤蓄水保水能力。但翻耕主要是通过人为耕作使表层土壤砂粒含量降低,并使土壤容重降低、土壤孔隙度增加。因此,可更多的选用免耕苜蓿和免耕玉米两种土地管理措施,以保持农业的持续发展。
-
![]()
图 1 不同土地恢复措施下剖面土壤粒度变化
[注(Note):WL—撂荒地Uncultivated field; CTC—传统翻耕 Conventional tillage; NTC—免耕种植玉米 No-tillage corn; NTA—免耕种植苜蓿 No-tillage alfalfa.]
Figure 1. Changes of soil particle sizes under different land restoration measures
![]()
图 2 不同土地恢复措施土壤含水量变化
[注(Note):WL—撂荒地Uncultivated field; CTC—传统翻耕 Conventional tillage; NTC—免耕种植玉米 No-tillage corn; NTA—免耕种植苜蓿 No-tillage alfalfa. 柱旁不同字母表示同一土层深度不同恢复措施间差异达到显著水平Different small letters by the bars indicate significantly different among the restoration measures for the same soil depth (P < 0.05).]
Figure 2. Changes of soil water contents under different restoration measures
表 1 不同土地恢复措施土壤粒度参数特征
Table 1 Characteristics of soil particle size parameters under different restoration measures
恢复措施
Restoration measure土层深度 (cm)
Soil depth平均粒径 (Φ)
Mean中值粒径 (Φ)
Median分选系数 (Φ)
Sorting coefficient偏度 (Φ)
Skewness峰度 (Φ)
Kurtosis撂荒地
Uncultivated land0—10 3.55 3.54 0.57 –0.04 1.01 10—20 3.58 3.57 0.59 –0.05 1.03 20—30 3.57 3.56 0.63 –0.11 1.23 30—40 3.55 3.54 0.55 –0.04 1.02 40—50 3.55 3.54 0.64 –0.12 1.29 传统翻耕
Conventional tillage0—10 4.50 4.24 1.52 0.37 1.59 10—20 4.53 4.26 1.50 0.40 1.55 20—30 4.01 3.91 1.08 0.32 1.58 30—40 3.89 3.82 1.02 0.22 1.41 40—50 3.64 3.46 1.11 0.30 1.30 免耕玉米
No-tillage corn0—10 4.40 4.17 1.47 0.34 1.48 10—20 4.29 4.03 1.58 0.32 1.57 20—30 3.60 3.59 0.77 0.08 1.26 30—40 3.70 3.66 0.95 0.24 1.58 40—50 3.77 3.73 0.90 0.18 1.38 免耕苜蓿
No-tillage alfalfa0—10 3.74 3.69 1.01 0.29 1.72 10—20 4.26 3.98 1.43 0.40 1.55 20—30 3.87 3.78 1.07 0.28 1.60 30—40 3.78 3.73 0.98 0.26 1.57 40—50 3.77 3.74 0.89 0.26 1.63  下载: 导出CSV
表 2 不同土地恢复措施土壤容重和孔隙度
Table 2 Soil bulk density and porosity under different restoration measures
恢复措施
Restoration measure土层深度 (cm)
Soil depth容重 (g/cm3)
Bulk density非毛管孔隙度 (%)
Non-capillary porosity毛管孔隙度 (%)
Capillary porosity总孔隙度 (%)
Total porosity撂荒地
Uncultivated land0—10 1.44 ± 0.04 a 3.43 ± 0.19 b 44.07 ± 0.80 a 47.50 ± 0.92 b 10—20 1.45 ± 0.02 a 1.47 ± 0.07 b 43.86 ± 0.67 a 45.33 ± 0.72 b 20—30 1.51 ± 0.02 a 1.73 ± 0.20 c 42.77 ± 1.65 b 44.50 ± 1.81 b 30—40 1.48 ± 0.03 a 2.20 ± 0.29 b 42.13 ± 0.17 b 44.33 ± 0.38 bc 40—50 1.44 ± 0.05 a 1.40 ± 0.21 c 40.76 ± 2.37 ab 42.16 ± 2.52 b 传统翻耕
Conventional tillage0—10 1.10 ± 0.02 c 6.97 ± 0.23 b 47.71 ± 0.25 a 54.68 ± 0.35 a 10—20 1.19 ± 0.03 c 5.73 ± 0.41 b 44.36 ± 0.77 a 50.09 ± 1.16 a 20—30 1.38 ± 0.01 b 3.10 ± 0.20 a 46.13 ± 0.70 a 49.23 ± 0.85 a 30—40 1.39 ± 0.01 b 2.27 ± 0.18 b 46.80 ± 0.38 a 49.06 ± 0.50 a 40—50 1.5 ± 0.01 a 1.80 ± 0.12 c 44.78 ± 0.43 a 46.58 ± 0.54 a 免耕玉米
No-tillage corn0—10 1.37 ± 0.01 ab 24.9 ± 6.30 a 22.27 ± 6.75 b 47.17 ± 0.46 b 10—20 1.37 ± 0.01 b 13.5 ± 2.66 a 32.98 ± 2.17 b 46.48 ± 0.49 b 20—30 1.41 ± 0.01 b 2.53 ± 0.07 b 42.00 ± 0.75 b 44.53 ± 0.68 b 30—40 1.42 ± 0.01 b 4.13 ± 0.54 a 39.39 ± 0.64 c 43.52 ± 0.35 c 40—50 1.45 ± 0.03 a 3.55 ± 0.03 a 44.15 ± 0.26 a 47.70 ± 0.23 a 免耕苜蓿
No-tillage alfalfa0—10 1.36 ± 0.02 b 2.93 ± 0.68 b 46.34 ± 0.23 a 49.27 ± 0.87 b 10—20 1.39 ± 0.02 ab 3.40 ± 0.10 b 44.00 ± 0.26 a 47.4 ± 0.36 b 20—30 1.41 ± 0.01 b 1.70 ± 0.12 c 44.60 ± 0.63 ab 46.30 ± 0.75 ab 30—40 1.47 ± 0.01 b 1.90 ± 0.28 b 43.40 ± 0.48 b 45.20 ± 0.23 b 40—50 1.47 ± 0.01 a 2.67 ± 0.26 b 37.82 ± 0.57 b 40.48 ± 0.44 b 注(Note):数据后不同字母表示在同一土层深度不同恢复措施间差异达到显著水平 (P < 0.05) Values followed different letters indicate significantly differences among restoration measures in the same sampling soil depth (P < 0.05)
下载: 导出CSV
表 3 土壤粒度、物理特征和含水量间的相关性分析
Table 3 Correlation analysis of soil particle size, physical characteristics and water contents
项目Item 砂粒Sand 粉粒Silt 粘粒Clay BD N-CP CP TP SWC SMC CMC 砂粒Sand 1 粉粒Silt –0.959** 1 粘粒Clay –0.829** –0.754** 1 BD 0.517* –0.677** –0.291 1 N-CP –0.679** 0.617** 0.628* –0.287 1 CP 0.443 –0.323 –0.428* –0.124 –0.848** 1 TP –0.385 0.497* 0.249 –0.736** 0.209 0.342 1 SWC –0.619** 0.639* 0.387 –0.515* 0.505* –0.250 0.434 1 SMC –0.265 0.435 0.086 –0.861** 0.022 0.432 0.836** 0.415 1 CMC –0.474** 0.584* 0.292 –0.722** 0.15 0.264 0.751** 0.312 0.695** 1 注(Note):BD—土壤容重 Bulk density;N-CP—非毛管孔隙度 Non-capillary porosity;CP—毛管孔隙度 Capillary porosity;TP—总孔隙度 Total porosity;SWC—土壤含水量 Soil water content;SMC—饱和持水量 Saturated moisture capacity;CMC—毛管持水量 Capillary moisture capacity. *—P < 0.05;**—P < 0.01.
下载: 导出CSV
-
[1] 巩杰, 陈利顶, 傅伯杰, 等. 黄土丘陵区小流域植被恢复的土壤养分效应研究[J]. 水土保持学报, 2005, 1: 93–96. DOI: 10.3321/j.issn:1009-2242.2005.03.023 Gong J, Chen L D, Fu B J, et al. Effects of vegetation restoration on soil nutrient in a small catchment in hilly loess area[J]. Journal of Soil and Water Conservation, 2005, 1: 93–96. DOI: 10.3321/j.issn:1009-2242.2005.03.023
[2] Qiao Y L, Ma B Z, Feng J L. Study on monitoring farmland by using remote sensing and GIS in Shanxi China[J]. Advanced Space Research. 2000, 26, 1059–1064. DOI: 10.1016/S0273-1177(99)01118-7
[3] Yuan J G, Li BM, Wan J M, Ren L X. Research of protecting cultivation in the northwest arid area of Shanxi Province[J]. Journal of Shanxi Agriculture University, 2004, 24, 347–350.
[4] Yuan Z Q, Yu K L, Epsteinc H, et al. Effects of legume species introduction on vegetation and soil nutrient development on abandoned croplands in a semi-arid environment on the Loess Plateau China[J]. Science of Total Environment, 2006, 541: 692–700.
[5] Zhao B Q, Li X Y, Liu H, et al. Results from long-term fertilizer experiments in China: The risk of groundwater pollution by nitrate[J]. NJAS-Wageingen Journal of Life Sciences, 2011, 58: 177–183. DOI: 10.1016/j.njas.2011.09.004
[6] Shi X H, Yang X M, Drury C F, et al. Impact of ridge tillage on soil organic carbon and selected physical properties of a clay loam in Southwestern Ontario[J]. Soil Tillage & Research, 2012, 120: 1–7.
[7] Franzluebbers A J, Schomberg H H, Endale D M. Surface-soil responses to paraplowing of long-term no-tillage cropland in the Southern Piedmont USA[J]. Soil Tillage & Research, 2007, 96: 303-315.
[8] Ben Moussa-Machraoui S, Errouissi F, Ben-Hammouda M, Nouira S. Comparative effects of conventional and no-tillage management on some soil properties under Mediterranean semi-arid conditions in Northwestern Tunisia[J]. Soil Tillage & Research, 2010, 106: 247–253.
[9] Sharma P, Abrol V, Sharma R K. Impact of tillage and mulch management on economics, energy requirement and crop performance in maize-wheat rotation in rainfed subhumid inceptisols[J]. Indian Europe Journal of Agronomy, 2011, 34: 46–51. DOI: 10.1016/j.eja.2010.10.003
[10] Andreini M S, Steenhuis T S. Preferential paths of flow under conventional and conservation tillage[J]. Geoderma, 1990, 46: 85–102. DOI: 10.1016/0016-7061(90)90009-X
[11] Marshall M R, Ballard C E, Frogbrook Z L, et al. The impact of rural land management changes on soil hydraulic properties and runoff processes: results from experimental plots in upland UK[J]. Hydrology Process, 2014, 28: 2617–2629. DOI: 10.1002/hyp.9826
[12] 李金峰, 杨智勇, 薛丽萍. 晋西北缓坡丘陵风沙区生态恢复的主要途径和技术措施探讨[J]. 山西水土保持科技, 2009, (1): 8–11. DOI: 10.3969/j.issn.1008-0120.2009.01.004 Li J F, Yang Z Y, Xue L P. Discussion on main technical measures of ecological restoration in hilly of Northwest Shanxi Province[J]. Soil and Water Conservation Science and Technology in Shanxi, 2009, (1): 8–11. DOI: 10.3969/j.issn.1008-0120.2009.01.004
[13] 廖晓勇, 陈治谏, 刘邵权, 等. 三峡库区小流域土地利用方式对土壤肥力的影响[J]. 生态环境, 2005, 14 (1): 99–101. DOI: 10.3969/j.issn.1674-5906.2005.01.021 Liao X Y, Chen Z J, Liu S Q, et al. Effects of land use types on soil fertility in small watershed in the Three Gorges Reservoir[J]. Ecology and Environment, 2005, 14 (1): 99–101. DOI: 10.3969/j.issn.1674-5906.2005.01.021
[14] 傅伯杰, 陈利顶, 马克明. 黄土丘陵区小流域土地利用变化对生态环境的影响—以延安市羊圈沟流域为例[J]. 地理学报, 1999, 54 (3): 241–246. DOI: 10.3321/j.issn:0375-5444.1999.03.006 Fu B J, Chen L D, Ma K M. The effect of land use change on the regional environment in the Yangjuangou catchment in the Loess Plateau of China[J]. Acta Geograpica Sinica, 1999, 54 (3): 241–246. DOI: 10.3321/j.issn:0375-5444.1999.03.006
[15] 许文强, 罗格平, 陈曦, 等. 干旱区绿洲不同土地利用方式和强度对土壤粒度分布的影响[J]. 干旱区地理, 2005, 28 (6): 800–804. DOI: 10.3321/j.issn:1000-6060.2005.06.015 Xu W Q, Luo G P, Chen X, et al. Effects of land use patterns and intensity on the distribution of soil granularity in the oases in arid areas[J]. Arid Land Geography, 2005, 28 (6): 800–804. DOI: 10.3321/j.issn:1000-6060.2005.06.015
[16] 王新平, 张志山, 张景光, 等. 荒漠植被影响土壤水文过程研究述评[J]. 中国沙漠, 2005, 25 (2): 196–201. DOI: 10.3321/j.issn:1000-694X.2005.02.006 Wang X P, Zhang Z S, Zhang J G, et al. Review to researches on desert vegetation influencing soil hydrological processes[J]. Journal of Desert Research, 2005, 25 (2): 196–201. DOI: 10.3321/j.issn:1000-694X.2005.02.006
[17] 常兆丰, 韩富贵, 仲生年, 等. 民勤荒漠区几种主要固沙植物群落的水分平衡特性[J]. 干旱区地理, 2012, 35 (1): 141–144. Chang Z F, Han F G, Zhong S N, et al. Characteristics of the water balance of plant communities in the Minqin Desert area[J]. Arid Land Geography, 2012, 35 (1): 141–144.
[18] 柳媛普, 张强, 赵建华, 等. 气温升高对黄土高原半干旱区路面特征影响的数值模拟[J]. 干旱区研究, 2015, 32 (6): 1097–1102. Liu Y P, Zhang Q, Zhao J H, et al. Numerical simulation of climate warming impaction on the land surface characters in the semi arid region of loess plateau[J]. Arid Zone Research, 2015, 32 (6): 1097–1102.
[19] 张军红, 吴波. 干旱、半干旱地区土壤水分研究进展[J]. 中国水土保持, 2012, (2): 40–42. DOI: 10.3969/j.issn.1000-0941.2012.02.016 Zhang H J, Wu B. Review on research of soil moisture in arid and semiarid areas[J]. Soil and Water Conservation in China, 2012, (2): 40–42. DOI: 10.3969/j.issn.1000-0941.2012.02.016
[20] 王军, 傅伯杰, 蒋小平. 土壤水分异质性的研究综述[J]. 水土保持学报, 2002, 16 (1): 1–5. DOI: 10.3321/j.issn:1009-2242.2002.01.001 Wang J, Fu B J, Jiang X P. Review on research of soil moisture heterogeneity[J]. Journal of Soil and Water Conservation, 2002, 16 (1): 1–5. DOI: 10.3321/j.issn:1009-2242.2002.01.001
[21] 古文婷. 晋西北黄土丘陵区不同植物群落土壤水分变化规律研究[D]. 山西太谷: 山西大学硕士学位论文, 2014. Gu W T. Soil moisture characteristics of different plant communities in the hilly region of Loess Plateau in northwest Shanxi[D]. Taigu, Shanxi: MS Thesis of Shanxi University, 2014.
[22] 任明达, 王乃梁. 现代沉积环境概论[M]. 北京: 科学出版社, 1981. Ren M D, Wang N L. Modern sediment environmental introduction[M]. Beijing: Science Press, 1981.
[23] 王永辉, 何旭, 海米提·依米提. 艾比湖湿地土壤粒度特征分析[J]. 干旱地区农业研究, 2014, 32 (6): 184–185. Wang Y H, He X, HaiMitiYimiti. Analysis of soil granularity in Ebinur Lake wetland[J]. Agricultural Research in The Arid Areas, 2014, 32 (6): 184–185.
[24] 程东娟, 张亚丽. 土壤物理实验指导[M]. 北京: 中国水利水电出版社, 2012. Cheng D J, Zhang Y L. Experimental guidance of soil physics[M]. Beijing: China Water & Power Press, 2012.
[25] 姜海燕, 赵雨森, 陈祥伟, 等. 大兴安岭岭南几种主要森林类型土壤水文功能研究[J]. 水土保持学报, 2007, 21 (3): 149–153. DOI: 10.3321/j.issn:1009-2242.2007.03.033 Jiang H Y, Zhao Y S, Chen X W, et al. Research on soil hydrology characteristics of some main forest type in south part of Daxing'anling[J]. Journal of Soil and Water Conservation, 2007, 21 (3): 149–153. DOI: 10.3321/j.issn:1009-2242.2007.03.033
[26] Folk R L, Ward W C. Brazos river bar: A study in significance of grain parameters[J]. Journal of Sedimentary Research, 1957, 27 (1): 3–26. DOI: 10.1306/74D70646-2B21-11D7-8648000102C1865D
[27] 胡淑萍, 余新晓, 岳永杰. 北京百花山森林枯落物层和土壤层水文效应研究[J]. 水土保持学报, 2008, 22 (1): 146–150. DOI: 10.3321/j.issn:1009-2242.2008.01.031 Hu S P, Yu X X, Yu Y J. Hydrological effects of forest litters and soil in Baihua mountain[J]. Journal of Soil and Water Conservation, 2008, 22 (1): 146–150. DOI: 10.3321/j.issn:1009-2242.2008.01.031
[28] 苏永中, 赵哈林. 科尔沁沙地不同土地利用和管理方式对土壤质量性状的影响[J]. 应用生态学报, 2003, 14 (10): 1681–1686. DOI: 10.3321/j.issn:1001-9332.2003.10.020 Su Y Z, Zhao H L. Effects of land use and management on soil quality of Horqin sandy land[J]. Chinese Journal of Applied Ecology, 2003, 14 (10): 1681–1686. DOI: 10.3321/j.issn:1001-9332.2003.10.020
[29] 吴美榕, 李志忠, 靳建辉, 等. 新疆伊犁河谷新垦荒地土壤粒度特征[J]. 河北师范大学学报 (自然科学版), 2011, 35 (2): 211–216. Wu M R, Li Z Z, Jin J H, et al. The soil grain size characteristics of the new reclamation wasteland in the Yili valley of Xinjiang[J]. Journal of Herbei Normal University (Natural Science Edition), 2011, 35 (2): 211–216.
[30] 庞奖励, 黄春长, 张旭. 关中地区古耕作土壤和现代耕作土壤微形态特征及意义[J]. 中国农业科学, 2006, 39 (7): 1395–1402. DOI: 10.3321/j.issn:0578-1752.2006.07.014 Pang J L, Huang C C, Zhang X. Micromorphological features of old cultivated and modern soil in Guanzhong areas of Shaanxi province, North China[J]. Scientia Agricultura Sinica, 2006, 39 (7): 1395–1402. DOI: 10.3321/j.issn:0578-1752.2006.07.014
[31] 庞奖励, 黄春长, 查小春, 等. 关中地区两种不同农业管理方式下土壤微形态特征[J]. 中国农业科学, 2007, 40 (11): 2518–2526. DOI: 10.3321/j.issn:0578-1752.2007.11.017 Pang J L, Huang C C, Cha X C, et al. Comparison of micromorphological features of two agricultural cultivated soils in Guanzhong areas of Shaanxi province[J]. Scientia Agricultura Sinica, 2007, 40 (11): 2518–2526. DOI: 10.3321/j.issn:0578-1752.2007.11.017
[32] 王贤, 张洪江, 程金花, 等. 重庆四面山几种林地土壤颗粒分形特征及其影响因素[J]. 水土保持学报, 2011, 25 (3): 154–159. Wang X, Zhang H J, Cheng J H, et al. Fractal characteristics and related affecting factors of particle size distribution of different forest soil in Simian Mountains, Chongqing[J]. Journal of Soil and Water Conservation, 2011, 25 (3): 154–159.
[33] Liu X, Zhang G C, Henathman G C, et al. Fractal features of soil particle-size distribution as affected by plant communities in the forested region of Mountain Yimeng, China[J]. Geoderma, 2009, 154 (1/2): 123–130.
[34] 尤为, 高照良, 边峰, 等. 黄土高原沟壑区不同施肥下植物对土壤容重和孔隙度的影响[J]. 陕西林业学报, 2014, 2 (6): 1–5. Eu W, Gao Z L, Bian F, et al. Effect of plants at different fertilization treatments on soil bulk density and porosity in the gully region of Loess Plateau[J]. Shaanxi Forest Science and Technology, 2014, 2 (6): 1–5.
[35] 吴乐知, 李取生, 刘长江. 微咸水淋洗对苏打盐渍土土壤理化性状的影响[J]. 生态与农村环境学报, 2006, 22 (2): 11–15. DOI: 10.3969/j.issn.1673-4831.2006.02.003 Wu L Z, Li Q S, Liu C J. Effects of leaching with mildly saline water on the physical and chemical properties of saline-sodic soil[J]. Journal of Ecology and Rural Environment, 2006, 22 (2): 11–15. DOI: 10.3969/j.issn.1673-4831.2006.02.003
[36] 黄冠华, 詹卫华. 土壤颗粒的分形特征及其应用[J]. 土壤学报, 2002, 39 (4): 490–497. DOI: 10.3321/j.issn:0564-3929.2002.04.006 Huang G H, Zhan W H. Fractal property of soil particle size distribution and its application[J]. Acta Pedologica Sinica, 2002, 39 (4): 490–497. DOI: 10.3321/j.issn:0564-3929.2002.04.006
[37] 李民义, 张建军, 王春香, 等. 晋西黄土高原区不同土地利用方式对土壤物理性质的影响[J]. 水土保持学报, 2013, 23 (3): 126–130. Li Y M, Zhang J J, Wang C X, et al. Effects of land use types on soil physical properties in Loess Plateau of Western Shanxi[J]. Journal of Soil and Water Conservation, 2013, 23 (3): 126–130.
[38] 中国科学院南京土壤研究所编. 土壤理化分析[M]. 上海: 上海科学技术出版社, 1978. Institute of Soil Science, Chinese Academy of Sciences. Physical and chemical analysis of soil[M]. Shanghai: Shanghai Scientific and Technical Publishers, 1978.
[39] 许景伟, 李传荣, 夏江宝, 等. 黄河三角洲滩地不同林分类型的土壤水文特性[J]. 水土保持学报, 2009, 23 (1): 173–176. DOI: 10.3321/j.issn:1009-2242.2009.01.037 Xu J W, Li C Y, Xia J B, et al. Soil hydrological properties of different forest types in lowlands of the Yellow River Delta[J]. Journal of Soil and Water Conservation, 2009, 23 (1): 173–176. DOI: 10.3321/j.issn:1009-2242.2009.01.037
[40] 刘阳, 陈波, 杨新兵, 等. 冀北山地典型森林土壤颗粒分形特征[J]. 水土保持学报, 2012, 26 (3): 159–163, 168. Liu Y, Chen B, Yang X B, et al. Fractal characteristics of soil particles of typical forest in north mountain of Hebei Province[J]. Journal of Soil and Water Conservation, 2012, 26 (3): 159–163, 168.
-
期刊类型引用(0)
其他类型引用(2)
计量
- 文章访问数: 2438
- HTML全文浏览量: 1147
- PDF下载量: 65
- 被引次数: 2
