
Spatial variability characteristics and impacting factors of soil trace elements in Poyang Lake plain, Jiangxi of China
-
摘要:目的
开展土壤微量元素空间分异及其影响因素的分析,能更客观地阐明土壤微量元素变化的内在机理,对田间土壤肥力的有效管控和保障人类健康、保护土壤生态环境具有重要意义。
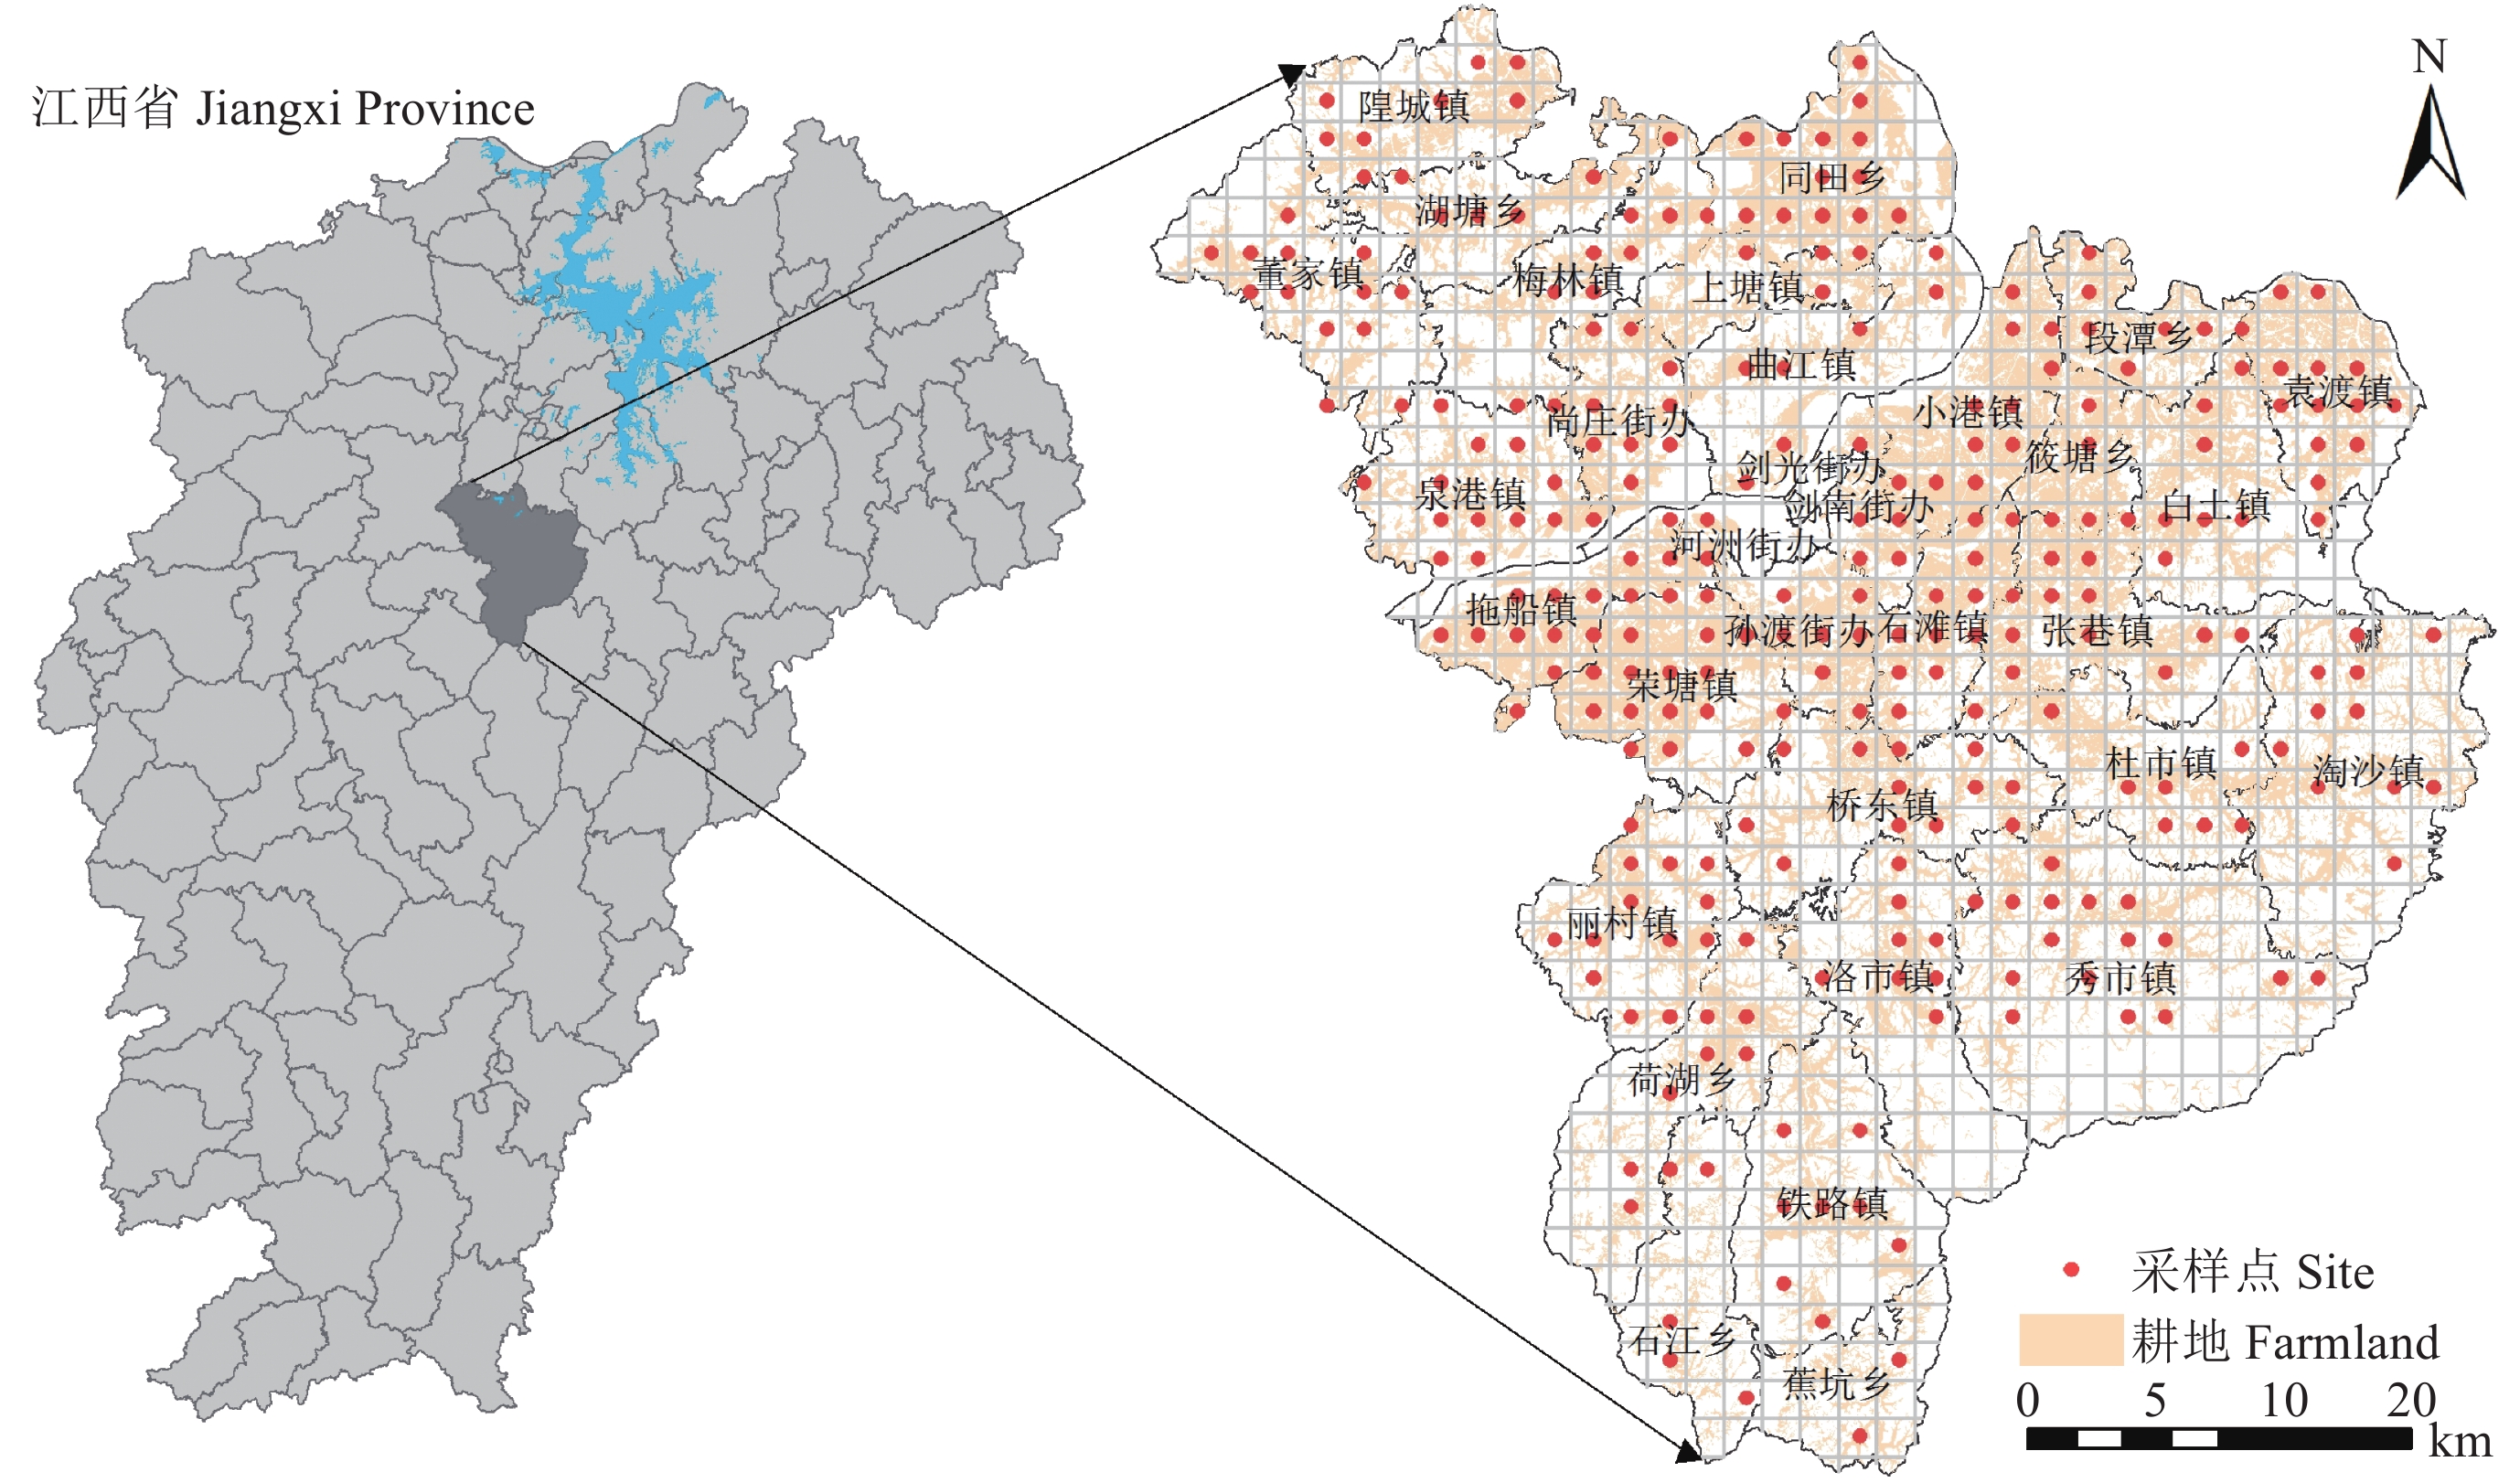
方法在江西省丰城市鄱阳湖平原农田区,采用网格布点法布设283个采样点,每个采样点取0—20 cm表层土壤,对样点数据用三倍标准差法剔除异常值20个,实际利用样点数为263个,分析了土壤样品pH、质地、氮、磷、钾和硼(B)、锰(Mn)、钼(Mo)、硒(Se)、碘(I)、氟(F) 6种微量元素的含量。采用地统计学理论、方差分析、相关分析以及回归分析方法,对鄱阳湖平原区农田土壤6种微量元素的含量、空间分布特征及其影响因素进行分析。
结果B、Mo含量均值处于丰富与上限值之间;Mn含量均值为330.24 mg/kg,处于缺乏水平;Se、I含量均值处于适量水平;F含量均值为474.59 mg/kg,处于边缘水平;6种微量元素含量均为中等程度变异,但各元素含量变异程度有所差异。B、Mn、Mo元素的最优插值模型为指数模型,Se、I、F均为球状模型。I元素的块金效应 < 25%,其他5种微量元素处于27.09%~41.77%。6种微量元素含量的空间分布格局差异较为明显,除Se元素不缺乏外,其余5种微量元素均处在缺乏水平。B、Mn、F含量均受到土壤类型、耕层质地的显著影响,Mn、Mo含量与坡度、pH间均达到极显著相关水平,Mn、Se、I含量与全磷含量显著相关,坡向与到河流的距离与6种微量元素含量未达到显著相关关系,其他影响因素仅对某些种元素表现出显著或极显著相关关系。在B、I含量的主要影响因素中,以耕层质地的影响最大;在Mn、Mo元素含量的主要影响因素中,以pH的贡献率最高;Se元素含量与土壤类型、全磷、坡度、高程之间达到显著或极显著相关水平,以全磷的影响程度最高;F元素含量与土壤类型、耕层质地、全氮含量相关显著,且全氮为主要影响因素。
结论1) 研究区域土壤B、Mo的含量总体较高,I、Se含量适量偏上,Mn总体上较为缺乏,F处于边缘水平;6种元素含量均为中等程度变异。2) 土壤微量元素B、Mn、Mo的最优插值模型为指数模型,Se、I、F则为球状模型;除I具有强烈的空间自相关外,其余5种元素表现为中等程度的空间自相关。3) 微量元素含量影响因素中,坡向、到河流的距离与各元素含量间未达到显著相关关系;B、I含量均受耕层质地的影响最大,Mn、Mo含量主要受pH的影响,Se含量主要受全磷的影响,F元素含量则主要受全氮的影响。
Abstract:ObjectivesConducting analysis of spatial variation and impacting factors of trace elements and understanding the interior mechanism of the phenomenon are needed for the effective management of soil fertility, maintaining of human health and protection of soil ecological enviroment.
MethodsUsing grid placement method, 283 soil samples (0–20 cm) were collected in Poyang Lake plain, Jiangxi Province. 20 samples with abnormal values beyond triple folds of standard deviation were screened off. The pH, texture, N, P, K and 6 trace element(B, Mn, Mo, Se, I, F) contents were determined. Using geostatistic theory, variance analysis, correlation analysis and regression analysis methods to analysis the relationship among the trace element contents, spatial distribution variation and the impacting factors were analyzed.
ResultsThe average contents of B and Mo are between abundant and upper limit. The Mn is 330.24 mg/kg, which is deficient. The Se and I are at moderate level. And the F is 474.59 mg/kg at marginal level. All the 6 elements have moderate variation, but the variation degree of each element is different. The optimal interpolation models of B, Mn and Mo are exponential, while Se, I and F are spherical. The nugget effect of I is less than 25%, while the other five elements are between 27.09% and 41.77%. The spatial distribution pattern of the six trace elements are comparatively different. Except that the content of Se isn’ t deficient in the whole area, the other five elements all are deficient. B, Mn, F elements are affected by soil type, topsoil texture significantly. The correlation between Mn, Mo and slope, pH reached extremely significant levels. Mn, Se, I and the total P showed significant correlation. There are no correlation between the slope direction and the distance to the river with the six elements. Other factors only show significant or extremely significant correlation with a few elements. The topsoil texture has the greatest influence to B and I among their main factors, pH contributed the most to the content change of Mn and Mo among the main factors. The content of Se reach significant or extremely significant correlation with soil type, total P, slope and elevation, with the total P has the highest impact. The correlation between the content of F and soil type, topsoil texture and total N are significantly, and total N was the main influencing factor.
Conclusions1) The total contents of soil trace elements B and Mo are relatively high of the study area, the I and Se are at the moderate level, and the Mn is relatively deficient overall. The F is at the marginal level. All the six elements show moderate variation. 2) The optimal interpolation models of soil trace elements B, Mn and Mo are exponential, while those of Se, I and F are spherical. Except for the consuming spatial autocorrelation of element I, the other five elements show moderate level. 3) Among the all impacting factors of trace elements, there is no significant correlation between the slope direction, the distance to the river with the content of each element. The element B and I are most affected by topsoil texture, pH influenced Mn and Mo mostly, Se is mostly impacted by total P, while F is mainly affected by total N.
-
Keywords:
- Poyang Lake plain /
- soil trace elements /
- spatial variation
-
空间变异是土壤固有的一种自然特性[1],进行土壤时空变化信息的定量精准估计,提高对土壤空间分布特征的认识,对于可持续农业发展、自然资源生态管理具有重要意义[2-5]。微量元素是土壤的重要组成成分,其含量受土壤本身及人类耕作行为的共同影响,它的空间分布特征与土壤发育、成土及其演化过程相关,也是土壤空间异质性的具体表现[6-7]。
地统计学被证实是研究土壤性质空间分异的有效方法[8-9],20世纪70年代开始,国外部分学者将该方法引入土壤科学中开始了土壤空间异质性的研究[10-13],80年代Webster等[14]对农田土壤微量元素的空间特征及其相关性进行了研究。White等[15]绘制了美国土壤有效态锌含量的等值图,阐述了其空间分布特征。国内应用地统计学进行土壤空间变异的研究起步较晚,20世纪90年代中期以后,一些学者逐渐开展了土壤养分空间变异及其影响因素的研究并取得了一些成果[16-19]。马媛等[20]以新疆三工河流域为例,采用地统计方法研究了干旱区流域土壤微量元素的空间异质性特征。史文娇等[21]利用GIS与地统计学相结合的方法对黑龙江省黑土区双城市的土壤微量元素空间分布特征及其影响因素进行了研究。土壤养分空间变异的研究已较为成熟,研究对象不仅针对大量元素 (N、P、K) 和有机质[22-27],也逐步转向微量元素[28-31],但对必需营养元素B、Mn、Mo和人体必需元素Se、I、F的研究依然尚浅。B、Mn、Mo对作物产量与产品品质具有重要作用[32],而土壤中Se、I、F虽然不是植物生长发育的必需营养元素,却是人体必需的微量元素,土壤作为Se、I、F元素的载体,通过食物链对人体健康产生影响[33]。土壤微量元素的空间分布差异会引起作物对土壤养分的非均衡吸收,进而影响人体元素的失衡[34]。因此,开展土壤微量元素空间分异及其影响因素的分析,能够更加客观地阐明土壤微量元素变化的内在机理,这对田间土壤肥力的有效管控、保障人类健康、保护土壤生态环境都有重要意义[10]。
本研究以典型鄱阳湖平原区—丰城市农田土壤为研究对象,在已有研究的基础上,根据实地调查采样数据,采用地统计学对微量元素空间分布特征进行研究,采用方差分析、相关分析和回归分析方法对微量元素与影响因素之间的关系进行研究,了解该区土壤微量元素特性,以期为微肥合理施用、精准农业与土壤保护措施提供参考依据。
1. 材料与方法
1.1 研究区概况
采样区位于江西省中部丰城市,地处赣江中下游,鄱阳湖盆地南端,东径115°25′~116°27′、北纬27°42′~28°27′。丰城总面积2845 km2,其中耕地面积约为8.3万hm2 (124.44万亩),是全国主要粮食生产基地,也是第一批国家农业可持续发展试验示范区。境内以平原地形为主,地势由西南向东北逐渐倾斜。全市土壤类型多,水田亚类包括潴育型水稻土、淹育型水稻土、潜育型水稻土;旱地亚类有红壤、红壤性土、潮土。成土母质包括泥质岩类风化物、第四纪红色粘土、红砂岩类风化物和河积物等10种类型。多数水田土层深厚,土壤渗而不漏、渍面不滞,富有较多的有机质,土质良好。耕层质地主要为重壤、中壤、砂壤、粘土。丰城富硒土壤资源总面积达524.70 km2,土壤中硒平均含量约0.538 μg/g。
1.2 土壤样品采集与测定
根据全市耕地分布情况,结合土壤类型与地貌条件,采用网格布点法布设283个采样点,每个采样点取0—20 cm表层土壤,并以周围3~5个样点的混合土壤作为该采样点土壤样品,利用GPS记录样点的空间位置信息,采样点分布见图1。将土壤样品在室温下自然风干、去杂、研磨、过筛,制备样品,全Se含量采用硝酸–高氯酸–硼氢化钠消化,用氢化物发生—原子荧光光谱法 (AFS) 测定;全B含量采用碳酸钠熔融,水提取,用交流电弧—发射光谱法测定;全Mn含量测定采用氢氟酸–高氯酸–硝酸溶解,用电感耦合等离子体发射光谱法 (ICP-OES) 测定;Mo和I元素含量采用硝酸–高氯酸消煮,用电感耦合等离子体质谱法 (ICP-MS) 测定;F含量采用硝酸–氢氧化钾浸提,用离子选择性电极法 (ISE) 测定。
1.3 数据处理与分析方法
对样点数据用三倍标准差法剔除异常值20个,实际利用样点数为263个。利用SPSS 22.0对数据进行统计分析、K-S正态分布检验[35],对不符合正态分布的数据进行相应的数据转换使之符合正态分布。
利用地统计学原理和方法确定土壤微量元素空间变异结构特征[36],在GS + 7.0软件中对转换后的数据进行半方差函数分析及模型拟合,以半方差分析结果中模型的拟合决定系数R2最大、残差平方和RSS (residual sum of squares) 最小为最优插值理论模型和参数;之后根据最优半方差模型参数运用ArcGIS 10.2软件进行普通克里金插值,得出微量元素空间分布图。
利用SPSS 22.0进行土壤微量元素与影响因素之间的相关分析、方差分析和逐步回归分析,定量分析各影响因素对微量元素的影响。
按照DZ/T 0295土地质量地球化学评价规范,制定出土壤微量元素含量分级标准 (表1)。
表 1 土壤微量元素含量的描述性统计Table 1. Descriptive statistics of soil microelement contents元素
Element样本数
No. of
samples最小值
Min.
(mg/kg)最大值
Max.
(mg/kg)平均值
Mean
(mg/kg)标准差
SD偏度
Skewness峰度
Kurtosis变异系数
CV
(%)K-S检验值
K-S test
value分布类型
DistributionB 263 24.70 120.70 73.94 15.20 0.14 0.56 20.56 0.200 正态Normal Mn 263 120.00 752.00 330.24 135.82 0.01* –0.56* 41.13 0.200* 对数正态Lognormal Mo 263 0.32 1.70 0.91 0.24 0.08* 0.27* 26.37 0.200* 平方根正态
Square root normalSe 263 0.13 0.65 0.32 0.08 0.12* 1.06* 25.00 0.010* 近似对数正态
Approximate lognormalI 263 0.33 5.40 1.66 1.13 –0.20* –0.28* 68.07 0.084* 对数正态Lognormal F 263 231.00 683.00 474.59 87.72 –0.34* 0.36* 18.48 0.200* 对数正态Lognormal 注(Note):*—经相应转换处理后的偏度、峰度和K-S检验值The transferred skewness,kurtosis and K-S test values. 2. 结果与分析
2.1 土壤微量元素含量描述性统计分析
变异系数反映土壤特性空间变异程度,变异系数 ≥ 100%为强变异,10%~100%为中等变异,≤ 10%为弱变异[37]。由表1可发现,6种微量元素含量的变异系数在18.48%~68.07%,均处于中等变异程度,其变异强度表现为I > Mn > Mo > Se > B > F。经过K-S检验,B符合正态分布,Mn、I和F经过对数转换后符合正态分布,Mo经过平方根转换后符合正态分布,Se经过对数转换后为近似正态分布,满足地统计学分析假设的条件。
表 2 土壤微量元素含量分级标准 (mg/kg)Table 2. Grading standard of trace element contents in soils元素Element 上限Up limit 丰富Sufficient 较丰富Relative sufficient 中等Moderate 较缺乏Relative deficient 缺乏Deficient B ≥ 3000 > 65 55~65 45~55 30~45 ≤ 30 Mn ≥ 1500 > 700 600~700 500~600 375~500 ≤ 375 Mo ≥ 4 > 0.85 0.65~0.85 0.55~0.65 0.45~0.55 ≤ 0.45 元素Element 过剩Surplus 高High 适量Moderate 边缘Marginal 缺乏Deficient Se > 3.00 0.40~3.00 0.175~0.400 0.125~0.175 ≤ 0.125 I > 100.00 5.00~100.00 1.50~5.00 1.00~1.50 ≤ 1.00 F > 700 550~700 500~550 400~500 ≤ 400 注(Note):表中数据范围均为含上限不含下限 The range of data in the table contain upper limit but not lower limit. 根据微量元素分级标准 (表2),调查区域B含量为24.70~120.70 mg/kg,Mo含量为0.32~1.70 mg/kg,均处于丰富与上限值之间,总体含量丰富;Mn含量为120.00~752.00 mg/kg,平均330.24 mg/kg,总体较为缺乏;Se含量为0.13~0.65 mg/kg,平均0.32 mg/kg,处于适量水平;I含量为0.33~5.40 mg/kg,平均1.66 mg/kg,处于适量水平;F含量为231.00~683.00 mg/kg,平均474.59 mg/kg,处于边缘水平。
2.2 土壤微量元素空间结构特征分析
通过半方差分析来揭示土壤微量元素空间结构特征,各微量元素的半方差模型及拟合参数见表3。B、Mn、Mo元素的最优插值模型为指数模型,Se、I、F元素用球状模型拟合最优,6种元素的模型R2均大于0.6,说明相应的插值模型能较好的反映其空间结构特征。
表 3 土壤微量元素半方差模型及拟合参数Table 3. Semi-variance model and fitting parameters of soil trace elements元素Element 理论模型Model C0 C0 + C C0/(C0 + C) (%) A0 (km) R2 RSS B 指数模型Exponential 67.900000 250.600000 27.09 30.03 0.954 1.411 × 10³ Mn 指数模型Exponential 0.005230 0.013560 38.57 21.42 0.941 3.082 × 10⁻⁶ Mo 指数模型Exponential 0.002020 0.004836 41.77 161.97 0.775 7.173 × 10⁻⁷ Se 球状模型Spherical 0.003370 0.011270 29.90 81.10 0.851 5.719 × 10⁻⁶ I 球状模型Spherical 0.105000 0.620000 16.94 5.45 0.757 1.510 × 10⁻² F 球状模型Spherical 0.000674 0.002108 31.97 77.36 0.872 1.748 × 10⁻⁷ 注(Note):C0—块金值Nugget;C0 + C—基台值Sill;C0/(C0 + C)—块金效应Nugget/Sill;A0—变程Range.;RSS—残差Residual. 变程A0反映变量空间自相关范围,I元素的空间自相关距离最小,为5.45 km,Mo元素的空间自相关距离最大,为161.97 km,B、Mn、Se、F元素的空间自相关范围各有差异,农作物对不同微量元素的吸收偏好可能导致变程大小的差异[29]。
块金效应C0/(C0 + C) 表示随机部分空间变异性占总空间变异性的程度,能够反映变量的空间自相关程度,比值较大说明随机部分起主要作用,比值较小说明非人为结构因素起主要作用[38]。其比值 > 75%时表示元素的空间自相关性较弱,比值处于25%~75%时说明元素空间自相关性中等,比值 < 25%时,表示元素具有强烈的空间自相关性[21]。由表3可知,I元素的块金值 < 25%,其空间自相关性很强;其他5种元素的块金值处于27.09%~41.77%,这5种元素具有中等程度的空间自相关性。说明I元素受种植制度、耕作、施肥等人为因素的影响较小,主要受到土壤类型、地形因素、土壤性质等自然因素作用;其他5种元素受到自然因素和人为因素的共同影响。
2.3 土壤微量元素含量的空间分布特征分析
为了更直观的反映研究区土壤微量元素含量的空间分布特征,依据各元素最优插值模型,利用Arcgis 10.2的地统计分析模块分别进行普通克里金插值,得出研究区各元素含量的空间插值分布图 (图2)。依据微量元素含量分级标准,在Arcgis 10.2中分区统计各级别下的耕地面积、比例 (表4)。由图2和表4可以发现,丰城市耕地土壤中6种微量元素的空间分布格局比较明显,除Se元素不缺乏外,其余5种元素均处在缺乏水平。B元素相对缺乏的区域较小,主要分布在南部,缺乏和较为缺乏的耕地面积分别只占总耕地面积的0.03%和0.64%,大部分地区B元素含量为中等及以上,76.93%的耕地面积B含量为极丰富水平。Mn元素缺乏面积大,全市从北往南,多数地区缺Mn,占总耕地面积的67.47%。Mo元素含量以丰富为主,耕地总面积的64.28%处于极丰富水平,分布在市域的中北部及南部,缺乏、较缺乏和中等水平的耕地面积分别占总耕地面积的0.03%、1.06%和5.26%,主要分布在市域的东部地区。Se元素含量处于适量水平的耕地面积占总耕地面积的94.42%,只有5.58%的耕地面积处于较高水平,分布在西北、中南部地区。缺乏I元素的耕地面积占18.11%,处在边缘的耕地面积占33.33%,分布较为分散,主要分布在中部地区,其余耕地面积处于适量水平,占48.56%。F元素缺乏的耕地面积占13.94%,分布在西北部、南部和东北部,F元素含量高的耕地面积占15.21%,分布在市域的东南部、中北部。
![]() 图 2 研究区土壤微量元素含量空间分布图Figure 2. Spatial distribution of microelements in the surveyed region表 4 土壤微量元素含量不同级别面积和比例Table 4. Area and percentage of microelements under different grades in the surveyed region
图 2 研究区土壤微量元素含量空间分布图Figure 2. Spatial distribution of microelements in the surveyed region表 4 土壤微量元素含量不同级别面积和比例Table 4. Area and percentage of microelements under different grades in the surveyed region级别
GradeB Mn Mo 级别
GradeSe I F 面积Area (km2) 比例Proportion (%) 面积Area (km2) 比例Proportion (%) 面积Area (km2) 比例Proportion (%) 面积Area (km2) 比例Proportion (%) 面积Area (km2) 比例Proportion (%) 面积Area (km2) 比例Proportion (%) 丰富
Sufficient787.67 76.93 0 0 658.17 64.28 过剩
Surplus0 0 0 0 0 0 较丰富
Relative sufficient164.11 16.03 0 0 300.64 29.36 高
High57.14 5.58 0 0 155.77 15.21 中等
Moderate65.35 6.38 20.59 2.01 53.88 5.26 适量
Moderate966.79 94.42 497.17 48.56 228.48 22.31 较缺乏
Relative deficient6.54 0.64 312.54 30.52 10.90 1.06 边缘
Marginal0 0 341.30 33.33 496.92 48.53 缺乏
Deficient0.26 0.03 690.8 67.47 0.34 0.03 缺乏
Deficient0 0 185.46 18.11 142.76 13.94 2.4 土壤微量元素的影响因素分析
根据前文微量元素空间结构特征揭示的影响因素,本研究选择土壤类型、耕层质地、土壤性质 (pH、有机质含量、全氮含量、全磷含量、全钾含量)、地形因子 (坡度、坡向、高程) 以及样点到河流、居民点之间的距离作为本研究微量元素含量分布的影响因素,进一步探讨各因素引起微量元素空间变异的内在机理。因土壤类型与耕层质地为定性变量,采用方差分析方法,其余因素采用相关性分析方法,在此基础上,对各影响因素进行回归分析。
2.4.1 土壤类型与耕层质地
通过对土壤微量元素含量与土壤类型、耕层质地的方差分析 (表5),可以发现土壤类型对B、Mn、Se、F元素的空间变异特征存在显著影响 (P < 0.05),土壤类型对Mo、I元素的空间变异无显著影响 (P > 0.05)。耕层质地对B、Mn、I、F元素的空间特征有显著影响 (P < 0.05),对Mo、Se元素的空间结构变异无显著影响 (P > 0.05)。
表 5 微量元素含量与土壤类型、耕层质地方差分析 (F值)Table 5. Variance analysis of microelement contents affected by soil types and textures (F values)项目Item B Mn Mo Se I F 土壤类型Soil type 0.001 0.012 0.350 0.012 0.074 0.001 土壤质地Soil texture 0.001 0.000 0.229 0.695 0.013 0.000 对不同土壤类型的微量元素含量特征进行统计 (表6),发现有6种土壤的B、Mo含量均值达到较丰富或丰富水平;不同土壤间Mn含量差异明显,以红壤中含量均值最高,水稻土、红壤性土Mn含量均值处于缺乏水平;Se含量均值均处于适量水平;I含量均值差异明显,以红壤I含量均值最高;F含量均值差异较为明显,水稻土和潮土中的F含量均值都处在较缺乏水平,红壤、红壤性土中的F含量均值则为缺乏水平。不同土壤类型的成土母质各不相同,成土母质对微量元素含量有着主要影响[29, 39]。因而不同类型土壤的微量元素含量有所差异。
表 6 不同土壤类型土壤微量元素含量及变异系数Table 6. Content and coefficient of variation of microelements in different soil types土壤类型
Soil typeB Mn Mo Se I F 含量
Content
(mg/kg)变异系数
CV
(%)含量
Content
(mg/kg)变异系数
CV
(%)含量
Content
(mg/kg)变异系数
CV
(%)含量
Content
(mg/kg)变异系数
CV
(%)含量
Content
(mg/kg)变异系数
CV
(%)含量
Content
(mg/kg)变异系数
CV
(%)潴育型水稻土
Hydromorphic paddy soil74.39 ± 14.23 19.12 330.74 ± 133.73 40.43 0.91 ± 0.24 27.33 0.32 ± 0.08 25.36 1.67 ± 1.17 70.28 483.33 ± 87.15 18.03 淹育型水稻土
Submergenic paddy soil81.20 ± 17.81 21.93 293.56 ± 128.24 43.68 0.85 ± 0.20 24.13 0.31 ± 0.06 19.73 1.61 ± 0.97 60.58 444.43 ± 64.26 14.46 潜育型水稻土
Gleyed paddy soil60.35 ± 14.87 18.87 239.90 ± 66.57 27.75 0.89 ± 0.16 18.24 0.26 ± 0.05 18.28 1.08 ± 0.59 54.91 448.10 ± 74.79 16.69 红壤
Red soil69.42 ± 13.09 18.87 459.88 ± 170.01 36.97 1.08 ± 0.27 25.16 0.37 ± 0.07 17.77 2.49 ± 0.38 15.18 385.44 ± 74.01 19.20 红壤性土
Weakly developed red soil86.75 ± 23.15 26.70 278.25 ± 74.67 26.84 0.82 ± 0.12 15.75 0.29 ± 0.06 19.98 1.36 ± 0.41 29.93 393.50 ± 97.43 24.76 潮土
Fluvo-aquic soil58.88 ± 9.08 15.43 400.33 ± 91.12 22.76 0.90 ± 0.11 12.55 0.28 ± 0.09 32.67 1.44 ± 0.53 36.65 469.16 ± 48.91 10.42 注(Note):表中含量值为平均值 ± 标准差 The element content is mean ± SD. 由表7可发现,不论何种质地,耕层土壤B含量均值处于丰富水平;除砂壤质地的土壤Mo含量处于较丰富水平,其他3种质地耕层土壤处于丰富水平;不同质地耕层土壤中的Mn含量均值差异明显,粘土质地土壤中Mn含量均值处于较缺乏水平,在其余3种质地土壤中均处于缺乏水平,尤以砂壤质地最低;不同质地耕层土壤中Se含量差异不明显,均值大都处于适量水平,砂壤质地土壤中Se含量均值略低;粘土质地土壤中I含量均值最高,达到适量水平,砂壤质地土壤中I含量均值最低,处于缺乏水平;中壤质地土壤中F含量均值最高,达到适量水平,其余3种质地土壤中F含量均值处于边缘水平。一般情况下微量元素含量高低遵循粘土 > 壤土 > 砂土[40],Mn、Mo、I含量均表现出该趋势,但B、Se、F含量未表现出该趋势,可能与地形因素、河流影响以及人为因素等有关。
表 7 不同耕层质地土壤微量元素含量及变异系数Table 7. Content and coefficient of variation of microelements under different soil textures土壤质地
Soil textureB Mn Mo Se I F 含量
Content
(mg/kg)变异系数
CV
(%)含量
Content
(mg/kg)变异系数
CV
(%)含量
Content
(mg/kg)变异系数
CV
(%)含量
Content
(mg/kg)变异系数
CV
(%)含量
Content
(mg/kg)变异系数
CV
(%)含量
Content
(mg/kg)变异系数
CV
(%)砂壤Sandy 89.35 ± 19.00 21.26 189.25 ± 48.29 25.52 0.67 ± 0.15 22.39 0.28 ± 0.04 14.29 0.94 ± 0.64 68.09 485.25 ± 79.30 16.34 粘土Clay 72.46 ± 5.88 8.11 449.75 ± 262.97 58.47 0.93 ± 0.19 20.43 0.29 ± 0.06 20.69 2.49 ± 1.36 54.62 427.75 ± 83.83 19.60 中壤Medium loam 70.90 ± 16.39 23.12 302.71 ± 109.85 36.29 0.91 ± 0.25 27.47 0.32 ± 0.08 25.00 1.49 ± 1.09 73.15 508.56 ± 84.52 16.62 重壤Heavy loam 77.38 ± 12.55 16.22 366.72 ± 150.74 41.10 0.93 ± 0.24 25.81 0.32 ± 0.08 25.00 1.88 ± 1.13 60.11 431.82 ± 72.36 16.76 2.4.2 土壤性质、地形因子与到河流或居民点的距离
相关性分析(表8)表明,土壤性质对微量元素含量的影响较大,地形因子、与到河流居民点的距离对微量元素含量的影响相对较小。土壤性质的影响因素中,pH与Mn、Mo含量表现出极显著正相关关系,与其余元素没有显著相关性;有机质、全氮含量仅与B含量表现出极显著负相关关系;全磷含量与Mn、Se、I含量均表现出显著负相关性;全钾含量仅与Mn元素含量表现出极显著的正相关关系。地形因子中,坡度与高程均与Mn、Se含量表现出显著、极显著负相关关系,坡度与Mo含量间表现为极显著负相关;坡向与6种元素的相关性均未达到显著水平。距离影响因素中,到河流的距离与各元素含量之间的相关性未达到显著水平;到居民点的距离仅与Mo元素含量表现出显著的负相关关系。
表 8 土壤微量元素含量与影响因素的相关性分析 (r值)Table 8. Correlation among microelement contents and soil factors (r value)因素Factor B Mn Mo Se I F pH –0.111 0.234** 0.219** –0.022 0.013 –0.084 有机质Organic matter –0.179** 0.102 0.138* –0.001 0.013 –0.061 全氮Total N –0.164** 0.120 0.104 0.018 0.108 –0.136* 全磷Total P –0.097 –0.134* –0.105 –0.137* –0.121* 0.091 全钾Total K 0.014 0.175** 0.003 0.064 0.022 –0.064 坡度Slope degree –0.026 –0.247** –0.175** –0.127* –0.119 –0.018 坡向Slope direction 0.033 0.094 0.007 0.075 0.071 0.032 高程Slope height –0.110 –0.286** –0.097 –0.188** –0.102 –0.049 到河流距离Distance to river 0.098 –0.005 0.052 0.047 –0.032 0.049 到居民点距离Distance to resident estate –0.044 –0.116 –0.161** –0.041 –0.039 0.009 注(Note):*—P < 0.05;**—P < 0.01. 2.4.3 不同影响因素回归分析
为了比较各因子对土壤微量元素含量的影响程度,以pH、有机质含量、全氮含量、全磷含量、全钾含量、坡度、高程、到河流距离、到居民点距离、土壤类型与耕层质地为自变量,分别以B、Mn、Mo、Se、I、F含量为因变量进行逐步回归分析,定量研究不同因子对微量元素含量空间变异的影响程度和相对重要性。各因素对微量元素含量逐步回归分析结果见表9,表中△R2为增加变量时回归方程判定系数的增量,Ri2为矫正决定系数,反映回归方程所有自变量对因变量变异性的解释比例。
表 9 土壤微量元素含量与影响因素的多元逐步回归分析Table 9. Multivariate stepwise regression analysis between soil microelement content and impacting factor元素
Element进入方程的影响因子Factors involved in model Ri2 因素Factor ΔR2 因素Factor ΔR2 因素Factor ΔR2 B 土壤类型Soil type 0.0160 耕层质地Soil texture 0.9380 有机质Organic matter 0.0010 0.9540 Mn 土壤类型Soil type 0.0002 耕层质地Soil texture 0.0005 pH 0.9930 0.9940 Mo 有机质Organic matter 0.0010 pH 0.9820 0.9830 Se 土壤类型Soil type 0.0160 全磷Total P 0.9610 0.9770 I 耕层质地Soil texture 0.8610 全磷Total P 0.0070 0.8670 F 耕层质地Soil texture 0.0170 土壤类型Soil type 0.0040 全氮Total N 0.9690 0.9910 通过表9可知,土壤类型、耕层质地、有机质对B含量的空间变异影响显著,其中有机质能独立解释其空间变异的0.1%,土壤类型能独立解释1.6%,耕层质地能独立解释93.8%,表明耕层质地对B含量的影响最大。Mn含量空间变异受土壤类型、耕层质地与pH的影响显著,以pH的影响最大,能独立解释其空间变异的99.3%。Mo含量的空间变异受有机质与pH的共同影响显著,pH能独立解释其空间变异的98.2%,有机质则独立解释0.1%。Se含量空间变异受土壤类型、全磷含量的影响显著,合计能够解释其空间变异的97.7%。I含量空间变异受耕层质地与全磷含量的影响显著,合计能解释其空间变异的86.7%。F含量的空间变异受耕层质地、土壤类型与全氮的共同影响显著,其中全氮能独立解释其空间变异的96.9%。
3. 讨论
研究表明,适量施用B、Mn、Mo微肥能够提高水稻产量[41-42]、改善籽粒品质[43],且B、Mo营养具有明显的互作效应[44]。Se元素具有提高人体免疫力、预防癌症等生物学功能[45],I、F元素则分别在合成甲状腺素促进人体新陈代谢、促进骨骼代谢和生长发育过程中具有极其重要作用[33]。土壤中的微量元素通过食物链的传递最终进入人体,对人类健康产生影响。研究区耕地86.6%为水田,种植水稻作物,因而根据该区微量元素空间分异特征,制定合理的微肥施用方案,对该区耕地的保护、促进作物生长和人类健康具有重要作用。
在空间分布方面,Se含量在全区域表现为适量水平;B、Mo含量仅在耕地较分散的极小范围内 (南、东) 呈现缺乏,其他地区含量比较丰富;I和F含量在有些地区表现为缺乏,其中I缺乏地区比较分散,F缺乏地区集中于西北、东北部分地区;Mn含量在全区域范围内表现为缺乏,仅少数地区处于中等含量水平。针对不同微量元素含量及空间分布规律,在微肥搭配过程中,要保持Se含量,控制B、Mo含量,增加Mn含量,I、F则应按区域针对性地增加其含量。
在影响因素方面,地形因素中坡度、高程对Mn、Se含量表现出显著或极显著负相关关系,说明海拔、坡度通过影响水热分配进一步影响微量元素的含量及形态[46]。但在逐步回归分析中未产生贡献率,可能是由于研究区处于湖滨平原区,境内以平原为主,地势相差不大,较为平缓,坡度和高程相对其他因素的影响程度不明显,因而未进入回归方程;而坡向与各微量元素的相关关系并不明显,这与张浩等[47]、张隆伟等[48]的研究结果相似。
在土壤性质影响因素方面,Mn、Mo含量与pH之间表现为极显著正相关关系,且回归分析中pH对其贡献率最大,说明研究区Mn、Mo含量主要受到土壤pH的影响。研究区土壤呈酸性,以水稻土为主,在水稻的生长发育过程中,伴随着土壤氧化还原反应的发生,土壤pH在一定范围内变化,Mn、Mo的溶解度随之改变,因而可能导致其含量受pH的变化影响较大,该结果与谢忠雷等[49]、刘学军等[50]研究结论相印证;研究区Se元素的相对富集,可能是因为土壤为酸性,在酸性和湿润的土壤中,Se元素主要为亚硒酸盐 (Se4+) 形态,容易与土壤中金属氧化物和有机质结合而稳定存在[51],Se含量的影响因素主要为土壤类型与全磷,而全磷对其含量的影响贡献率最大,土壤中磷的含量与化肥、农药的使用有重要联系,说明土壤中Se含量除受先天成土母质影响外,后期人为因素的影响也很重要,但Se含量与pH间未表现出显著相关性,可能是因为研究区整体pH在酸性范围内波动,变化相对较小,因而相关性不显著,这与周墨等[52]研究相似;回归分析结果表明,F含量受全氮的影响最大,土壤类型、耕层质地的影响相对很小,土壤中氮的来源与磷相似,受人为施肥的影响很大,说明F元素受人类行为的影响较大,结合Se含量的影响因素,可以表明化肥等外源养分的大量投入影响土壤化学性状,进而削弱了土壤类型、地形因子与土壤Se、F含量间的关系,这与前人[47, 53]研究相似研究相似;B、I含量的影响因素中贡献率最高的是耕层质地,说明B、I含量的主要影响因素是耕层质地,可能是由于不同质地的土壤粘粒不一,对微量元素B、I的吸附、保持能力不一。有研究也表明,土壤中B含量的影响因子中,吸附作用对其的影响最为重要,质地也有一定影响,质地粘重的土壤易于吸附B,使其不容易移动、淋失[32]。
在元素含量空间变异方面,对比微量元素含量空间变异系数及其影响因素空间变异系数,得到I元素 (CV = 68.07%) 与耕层质地 (CV = 17.7%) 相差最大,其次是Mn元素 (CV = 41.13%) 与pH (CV = 6.4%)、Mo (CV = 26.37%) 与pH (CV = 6.4%),Se (ΔCV = 7.1%)、B (ΔCV = 2.8%)、F (ΔCV = 1.7%) 与对应影响因素变异系数相差较小,该变异系数的差距说明本研究影响因素的空间变异与微量元素含量空间变异存在差距,可以推断除本研究分析的影响因素之外,还存在其他影响I、Mn、Mo元素含量空间变异的因素。
因此,微肥元素含量合理搭配是解决元素不足或过丰富的重要措施,进一步挖掘各微量元素含量影响因素是探索微量元素含量空间分布及空间迁移机制的重点,在下一步研究过程中,单个元素多影响因素多地区对比是深入分析鄱阳湖地区土壤微量元素含量时空变异的研究重点。
4. 结论
1) 研究区土壤微量元素B、Mo的含量总体较高,I、Se元素含量处于适量水平,Mn元素总体上较为缺乏,F元素的含量处于边缘水平;6种元素均为中等程度变异,但各元素变异程度有所差异。
2) 土壤微量元素B、Mn、Mo的最优插值模型为指数模型,Se、I、F元素用球状模型拟合最优;除I元素具有强烈的空间自相关外,其余5种元素表现为中等程度的空间自相关。
3) 在微量元素含量影响因素中,坡向、到河流的距离与各元素含量间的相关关系未达到显著水平。在B、I含量的主要影响因素中,耕层质地的影响程度最大;在Mn、Mo含量的主要影响因素中,pH贡献率最高;Se含量与土壤类型、全磷含量、坡度、高程之间达到显著、极显著水平,以全磷含量的影响程度最高;F含量与土壤类型、耕层质地、全氮含量间的相关性达显著水平,全氮含量为主要影响因素。
-
![]()
图 2 研究区土壤微量元素含量空间分布图
Figure 2. Spatial distribution of microelements in the surveyed region
表 1 土壤微量元素含量的描述性统计
Table 1 Descriptive statistics of soil microelement contents
元素
Element样本数
No. of
samples最小值
Min.
(mg/kg)最大值
Max.
(mg/kg)平均值
Mean
(mg/kg)标准差
SD偏度
Skewness峰度
Kurtosis变异系数
CV
(%)K-S检验值
K-S test
value分布类型
DistributionB 263 24.70 120.70 73.94 15.20 0.14 0.56 20.56 0.200 正态Normal Mn 263 120.00 752.00 330.24 135.82 0.01* –0.56* 41.13 0.200* 对数正态Lognormal Mo 263 0.32 1.70 0.91 0.24 0.08* 0.27* 26.37 0.200* 平方根正态
Square root normalSe 263 0.13 0.65 0.32 0.08 0.12* 1.06* 25.00 0.010* 近似对数正态
Approximate lognormalI 263 0.33 5.40 1.66 1.13 –0.20* –0.28* 68.07 0.084* 对数正态Lognormal F 263 231.00 683.00 474.59 87.72 –0.34* 0.36* 18.48 0.200* 对数正态Lognormal 注(Note):*—经相应转换处理后的偏度、峰度和K-S检验值The transferred skewness,kurtosis and K-S test values.  下载: 导出CSV
表 2 土壤微量元素含量分级标准 (mg/kg)
Table 2 Grading standard of trace element contents in soils
元素Element 上限Up limit 丰富Sufficient 较丰富Relative sufficient 中等Moderate 较缺乏Relative deficient 缺乏Deficient B ≥ 3000 > 65 55~65 45~55 30~45 ≤ 30 Mn ≥ 1500 > 700 600~700 500~600 375~500 ≤ 375 Mo ≥ 4 > 0.85 0.65~0.85 0.55~0.65 0.45~0.55 ≤ 0.45 元素Element 过剩Surplus 高High 适量Moderate 边缘Marginal 缺乏Deficient Se > 3.00 0.40~3.00 0.175~0.400 0.125~0.175 ≤ 0.125 I > 100.00 5.00~100.00 1.50~5.00 1.00~1.50 ≤ 1.00 F > 700 550~700 500~550 400~500 ≤ 400 注(Note):表中数据范围均为含上限不含下限 The range of data in the table contain upper limit but not lower limit.
下载: 导出CSV
表 3 土壤微量元素半方差模型及拟合参数
Table 3 Semi-variance model and fitting parameters of soil trace elements
元素Element 理论模型Model C0 C0 + C C0/(C0 + C) (%) A0 (km) R2 RSS B 指数模型Exponential 67.900000 250.600000 27.09 30.03 0.954 1.411 × 10³ Mn 指数模型Exponential 0.005230 0.013560 38.57 21.42 0.941 3.082 × 10⁻⁶ Mo 指数模型Exponential 0.002020 0.004836 41.77 161.97 0.775 7.173 × 10⁻⁷ Se 球状模型Spherical 0.003370 0.011270 29.90 81.10 0.851 5.719 × 10⁻⁶ I 球状模型Spherical 0.105000 0.620000 16.94 5.45 0.757 1.510 × 10⁻² F 球状模型Spherical 0.000674 0.002108 31.97 77.36 0.872 1.748 × 10⁻⁷ 注(Note):C0—块金值Nugget;C0 + C—基台值Sill;C0/(C0 + C)—块金效应Nugget/Sill;A0—变程Range.;RSS—残差Residual.
下载: 导出CSV
表 4 土壤微量元素含量不同级别面积和比例
Table 4 Area and percentage of microelements under different grades in the surveyed region
级别
GradeB Mn Mo 级别
GradeSe I F 面积Area (km2) 比例Proportion (%) 面积Area (km2) 比例Proportion (%) 面积Area (km2) 比例Proportion (%) 面积Area (km2) 比例Proportion (%) 面积Area (km2) 比例Proportion (%) 面积Area (km2) 比例Proportion (%) 丰富
Sufficient787.67 76.93 0 0 658.17 64.28 过剩
Surplus0 0 0 0 0 0 较丰富
Relative sufficient164.11 16.03 0 0 300.64 29.36 高
High57.14 5.58 0 0 155.77 15.21 中等
Moderate65.35 6.38 20.59 2.01 53.88 5.26 适量
Moderate966.79 94.42 497.17 48.56 228.48 22.31 较缺乏
Relative deficient6.54 0.64 312.54 30.52 10.90 1.06 边缘
Marginal0 0 341.30 33.33 496.92 48.53 缺乏
Deficient0.26 0.03 690.8 67.47 0.34 0.03 缺乏
Deficient0 0 185.46 18.11 142.76 13.94
下载: 导出CSV
表 5 微量元素含量与土壤类型、耕层质地方差分析 (F值)
Table 5 Variance analysis of microelement contents affected by soil types and textures (F values)
项目Item B Mn Mo Se I F 土壤类型Soil type 0.001 0.012 0.350 0.012 0.074 0.001 土壤质地Soil texture 0.001 0.000 0.229 0.695 0.013 0.000
下载: 导出CSV
表 6 不同土壤类型土壤微量元素含量及变异系数
Table 6 Content and coefficient of variation of microelements in different soil types
土壤类型
Soil typeB Mn Mo Se I F 含量
Content
(mg/kg)变异系数
CV
(%)含量
Content
(mg/kg)变异系数
CV
(%)含量
Content
(mg/kg)变异系数
CV
(%)含量
Content
(mg/kg)变异系数
CV
(%)含量
Content
(mg/kg)变异系数
CV
(%)含量
Content
(mg/kg)变异系数
CV
(%)潴育型水稻土
Hydromorphic paddy soil74.39 ± 14.23 19.12 330.74 ± 133.73 40.43 0.91 ± 0.24 27.33 0.32 ± 0.08 25.36 1.67 ± 1.17 70.28 483.33 ± 87.15 18.03 淹育型水稻土
Submergenic paddy soil81.20 ± 17.81 21.93 293.56 ± 128.24 43.68 0.85 ± 0.20 24.13 0.31 ± 0.06 19.73 1.61 ± 0.97 60.58 444.43 ± 64.26 14.46 潜育型水稻土
Gleyed paddy soil60.35 ± 14.87 18.87 239.90 ± 66.57 27.75 0.89 ± 0.16 18.24 0.26 ± 0.05 18.28 1.08 ± 0.59 54.91 448.10 ± 74.79 16.69 红壤
Red soil69.42 ± 13.09 18.87 459.88 ± 170.01 36.97 1.08 ± 0.27 25.16 0.37 ± 0.07 17.77 2.49 ± 0.38 15.18 385.44 ± 74.01 19.20 红壤性土
Weakly developed red soil86.75 ± 23.15 26.70 278.25 ± 74.67 26.84 0.82 ± 0.12 15.75 0.29 ± 0.06 19.98 1.36 ± 0.41 29.93 393.50 ± 97.43 24.76 潮土
Fluvo-aquic soil58.88 ± 9.08 15.43 400.33 ± 91.12 22.76 0.90 ± 0.11 12.55 0.28 ± 0.09 32.67 1.44 ± 0.53 36.65 469.16 ± 48.91 10.42 注(Note):表中含量值为平均值 ± 标准差 The element content is mean ± SD.
下载: 导出CSV
表 7 不同耕层质地土壤微量元素含量及变异系数
Table 7 Content and coefficient of variation of microelements under different soil textures
土壤质地
Soil textureB Mn Mo Se I F 含量
Content
(mg/kg)变异系数
CV
(%)含量
Content
(mg/kg)变异系数
CV
(%)含量
Content
(mg/kg)变异系数
CV
(%)含量
Content
(mg/kg)变异系数
CV
(%)含量
Content
(mg/kg)变异系数
CV
(%)含量
Content
(mg/kg)变异系数
CV
(%)砂壤Sandy 89.35 ± 19.00 21.26 189.25 ± 48.29 25.52 0.67 ± 0.15 22.39 0.28 ± 0.04 14.29 0.94 ± 0.64 68.09 485.25 ± 79.30 16.34 粘土Clay 72.46 ± 5.88 8.11 449.75 ± 262.97 58.47 0.93 ± 0.19 20.43 0.29 ± 0.06 20.69 2.49 ± 1.36 54.62 427.75 ± 83.83 19.60 中壤Medium loam 70.90 ± 16.39 23.12 302.71 ± 109.85 36.29 0.91 ± 0.25 27.47 0.32 ± 0.08 25.00 1.49 ± 1.09 73.15 508.56 ± 84.52 16.62 重壤Heavy loam 77.38 ± 12.55 16.22 366.72 ± 150.74 41.10 0.93 ± 0.24 25.81 0.32 ± 0.08 25.00 1.88 ± 1.13 60.11 431.82 ± 72.36 16.76
下载: 导出CSV
表 8 土壤微量元素含量与影响因素的相关性分析 (r值)
Table 8 Correlation among microelement contents and soil factors (r value)
因素Factor B Mn Mo Se I F pH –0.111 0.234** 0.219** –0.022 0.013 –0.084 有机质Organic matter –0.179** 0.102 0.138* –0.001 0.013 –0.061 全氮Total N –0.164** 0.120 0.104 0.018 0.108 –0.136* 全磷Total P –0.097 –0.134* –0.105 –0.137* –0.121* 0.091 全钾Total K 0.014 0.175** 0.003 0.064 0.022 –0.064 坡度Slope degree –0.026 –0.247** –0.175** –0.127* –0.119 –0.018 坡向Slope direction 0.033 0.094 0.007 0.075 0.071 0.032 高程Slope height –0.110 –0.286** –0.097 –0.188** –0.102 –0.049 到河流距离Distance to river 0.098 –0.005 0.052 0.047 –0.032 0.049 到居民点距离Distance to resident estate –0.044 –0.116 –0.161** –0.041 –0.039 0.009 注(Note):*—P < 0.05;**—P < 0.01.
下载: 导出CSV
表 9 土壤微量元素含量与影响因素的多元逐步回归分析
Table 9 Multivariate stepwise regression analysis between soil microelement content and impacting factor
元素
Element进入方程的影响因子Factors involved in model Ri2 因素Factor ΔR2 因素Factor ΔR2 因素Factor ΔR2 B 土壤类型Soil type 0.0160 耕层质地Soil texture 0.9380 有机质Organic matter 0.0010 0.9540 Mn 土壤类型Soil type 0.0002 耕层质地Soil texture 0.0005 pH 0.9930 0.9940 Mo 有机质Organic matter 0.0010 pH 0.9820 0.9830 Se 土壤类型Soil type 0.0160 全磷Total P 0.9610 0.9770 I 耕层质地Soil texture 0.8610 全磷Total P 0.0070 0.8670 F 耕层质地Soil texture 0.0170 土壤类型Soil type 0.0040 全氮Total N 0.9690 0.9910
下载: 导出CSV
-
[1] 毕如田, 李华. 不同地形部位耕地微量元素空间变异性研究-以永济市为例[J]. 土壤, 2005, 37(3): 290-294. DOI: 10.3321/j.issn:0253-9829.2005.03.011 Bi R T, Li H. Spatial variation of trace elements with landform of farmland-a case study of Yongji city[J]. Soils, 2005, 37(3): 290-294. DOI: 10.3321/j.issn:0253-9829.2005.03.011
[2] Karlen D L, Wienhold B J, Kang S, et al. Indices for soil management decisions[A]. Hatfield J L, Sauer T J. Soil management: building a stable base for agriculture[C]. Madison, America: American Society of Agronomy and Soil Science Society of America, 2011. 39-50.
[3] Lin H, Dan W, Bell J, et al. Assessment of soil spatial variability at multiple scales[J]. Ecological Modeling, 2005, 182(3): 271-290.
[4] Qiu Y, Fu B J, Wang J, Chen L D. Spatial prediction of soil moisture content using multiple-linear regressions in a Gully Catchment of the Loess Plateau, China[J]. Geographical Research, 2010, 74(2): 208-220.
[5] Cambardella C A, Moorman T B, Novak J M, et al. Field-scale variability of soil properties in central Iowa soils[J]. Soilence Society of America Journal, 1994, 58(5): 1501-1511. DOI: 10.2136/sssaj1994.03615995005800050033x
[6] 刘强, 杨东. 不同土壤类型有效微量元素的空间特征-以张掖市临泽县为例[J]. 水土保持研究, 2017, 24(6): 205-208. Liu Q, Yang D. Study on the contents of available trace elements in different soils-a case study in Linze area, Zhangye City[J]. Research of Soil and Water Conservation, 2017, 24(6): 205-208.
[7] 赵志忠, 毕华, 杨元根, 等. 海南岛西部地区砖红壤中微量元素含量及其分布特征[J]. 地球与环境, 2005, 33(2): 69-73. Zhao Z Z, Bi H, Yang Y G, et al. Spatial distribution pattern of trace elements contents of latosol in the west of Hainan island[J]. Earth and Environment, 2005, 33(2): 69-73.
[8] Behera S K, Shukla A K. Spatial distribution of surface soil acidity, electrical conductivity, soil organic carbon content and exchangeable potassium, calcium and magnesium in some cropped acid soils of India[J]. Land Degradation & Development, 2015, 26(1): 71-79.
[9] Liu J, Yang H, Zhao M, et al. Spatial distribution patterns of benthic microbial communities along the Pearl Estuary, China[J]. Systematic & Applied Microbiology, 2014, 37(8): 578-589.
[10] Hillel D. Research in soil physics: a review[J]. Soil Science, 1991, 151(1): 30-34. DOI: 10.1097/00010694-199101000-00006
[11] Webster R, Burgess T M. Optimal interpolation and isarithmic mapping of soil properties Ⅲ changing drift and universal kriging[J]. European Journal of Soil Science, 1980, 31(3): 505-524. DOI: 10.1111/j.1365-2389.1980.tb02100.x
[12] Yost R S, Uehara G, Fox A R L. Geostatistical analysis of soil chemical properties of large land areas. II. Kriging 1[J]. Soil Science Society of America Journal, 1982, 46(5): 1033-1037. DOI: 10.2136/sssaj1982.03615995004600050029x
[13] Hölemann J A, Schirmacher M, Prange A. Seasonal variability of trace metals in the lena river and the southeastern Laptev Sea: impact of the spring freshet[J]. Global & Planetary Change, 2005, 48(1): 112-125.
[14] Webster R, Nortcliff S. Improved estimation of micro nutrients in hectare plots of the sonning series[J]. European Journal of Soil Science, 1984, 35(4): 667-672. DOI: 10.1111/j.1365-2389.1984.tb00623.x
[15] White J G, Welch R M, Norvell W A. Soil zinc map of the USA using geostatistics and geographic information systems[J]. Soil Science Society of America Journal, 1997, 61(1): 185-194. DOI: 10.2136/sssaj1997.03615995006100010027x
[16] Li X F, Chen Z B, Chen H B, et al. Spatial distribution of soil nutrients and their response to land use in Eroded area of south China[J]. Procedia Environmental Sciences, 2011, 10(1): 14-19.
[17] 王军, 傅伯杰, 邱扬, 等. 黄土高原小流域土壤养分的空间分布格局-Kriging插值分析[J]. 地理研究, 2003, 22(3): 373-379. DOI: 10.3321/j.issn:1000-0585.2003.03.014 Wang J, Fu B J, Qiu Y, et al. Spatial distribution patterns of soil nutrients in a small catchment of the Loess Plateau-Kriging method[J]. Geographical Research, 2003, 22(3): 373-379. DOI: 10.3321/j.issn:1000-0585.2003.03.014
[18] 李艳, 史舟, 徐建明, 等. 地统计学在土壤科学中的应用及展望[J]. 水土保持学报, 2003, 17(1): 178-182. DOI: 10.3321/j.issn:1009-2242.2003.01.046 Li Y, Shi Z, Xu J M, et al. Utilization and perspective of geostatistics in soil sciences[J]. Journal of Soil and Water Conservation, 2003, 17(1): 178-182. DOI: 10.3321/j.issn:1009-2242.2003.01.046
[19] 朱静, 黄标, 孙维侠, 等. 长江三角洲典型地区农田土壤有机质的时空变异特征及其影响因素[J]. 土壤, 2006, 38(2): 158-165. DOI: 10.3321/j.issn:0253-9829.2006.02.008 Zhu J, Huang B, Sun W X, et al. Tempo-spatial variation of soil organic matter of farmland and its affecting factors in a typical area of the Yangtze River Delta region[J]. Soils, 2006, 38(2): 158-165. DOI: 10.3321/j.issn:0253-9829.2006.02.008
[20] 马媛, 师庆东, 杨建军, 吕光辉. 干旱区典型流域土壤微量元素的空间变异特征研究[J]. 干旱区地理, 2006, 29(5): 682-687. DOI: 10.3321/j.issn:1000-6060.2006.05.011 Ma Y, Shi Q D, Yang J J, Lv G H. Spatial variability of characters of soil trace elements in a watershed of arid area[J]. Arid Land Geography, 2006, 29(5): 682-687. DOI: 10.3321/j.issn:1000-6060.2006.05.011
[21] 史文娇, 汪景宽, 魏丹, 等. 黑龙江省南部黑土区土壤微量元素空间变异及影响因子-以双城市为例[J]. 土壤学报, 2009, 46(2): 342-347. DOI: 10.3321/j.issn:0564-3929.2009.02.021 Shi W J, Wang J K, Wei D, et al. Spatial variability of soil trace elements in black soil region of south Heilongjiang Province and its affecting factors-a case study of Shuangcheng City[J]. Acta Pedologica Sinica, 2009, 46(2): 342-347. DOI: 10.3321/j.issn:0564-3929.2009.02.021
[22] Castrignanò A, Giugliarini L, Risaliti R, et al. Study of spatial relationships among some soil physico-chemical properties of a field in central Italy using multivariate geostatistics[J]. Geoderma, 2000, 97(1): 39-60.
[23] Liu F C, Shi X Z, Dong-Sheng Y U, et al. Characteristics of spatial variability of total soil nitrogen in the typical area of Taihu Lake basin[J]. Geographical Research, 2004, 4(3): 68-73.
[24] 冯娜娜, 李廷轩, 张锡洲, 等. 不同尺度下低山茶园土壤有机质含量的空间变异[J]. 生态学报, 2006, 26(2): 349-356. DOI: 10.3321/j.issn:1000-0933.2006.02.006 Feng N N, Li T X, Zhang X Z, et al. The spatial variability of the content of organic matter in hilly tea plantation soils with different sampling scales[J]. Acta Ecologica Sinica, 2006, 26(2): 349-356. DOI: 10.3321/j.issn:1000-0933.2006.02.006
[25] 张彬, 杨联安, 杨粉莉, 等. 苹果主产区土壤养分空间分布特征及其影响因素-以陕西省礼泉县为例[J]. 土壤, 2016, 48(4): 777-784. Zhang B, Yang L A, Yang F L, et al. Spatial distribution of soil nutrients and their influential factors in apple production area: a case study of Liquan County, Shaanxi Province[J]. Soils, 2016, 48(4): 777-784.
[26] Bhunia G S, Shit P K, Chattopadhyay R. Assessment of spatial variability of soil properties using geostatistical approach of lateritic soil (West Bengal, India)[J]. Annals of Agrarian Science, 2018, 16(4): 436-443. DOI: 10.1016/j.aasci.2018.06.003
[27] 杨之江, 陈效民, 景峰, 等. 基于Gis和地统计学的稻田土壤养分与重金属空间变异[J]. 应用生态学报, 2018, 29(6): 1893-1901. Yang Z J, Chen X M, Jing F, et al. Spatial variability of nutrients and heavy metals in paddy field soils based on GIS and Geostatistics[J]. Chinese Journal of Applied Ecology, 2018, 29(6): 1893-1901.
[28] Liu X M, Xu J M, Zhang M K, et al. Application of geostatistics and GIS technique to characterize spatial variabilities of bioavailable micronutrients in paddy soils[J]. Environmental Geology, 2004, 46(2): 189-194.
[29] 武婕, 李玉环, 李增兵, 等. 南四湖区农田土壤有机质和微量元素空间分布特征及影响因素[J]. 生态学报, 2014, 34(6): 1596-1605. Wu J, Li Y H, Li Z B, et al. Spatial distribution and influencing factors of farmland soil organic matter and trace elements in the nansihu region. Acta Ecologica Sinica, 2014, 34(6): 1596-1605.
[30] 刘永红, 倪中应, 谢国雄, 等. 浙西北丘陵区农田土壤微量元素空间变异特征及影响因子[J]. 植物营养与肥料学报, 2016, 22(6): 1710-1718. DOI: 10.11674/zwyf.15343 Liu Y H, Ni Z Y, Xie G X, et al. Spatial variability and impacting factors of trace elements in hilly region of cropland in northwestern Zhejiang Province[J]. Journal of Plant Nutrition and Fertilizers, 2016, 22(6): 1710-1718. DOI: 10.11674/zwyf.15343
[31] 江叶枫, 钟珊, 饶磊, 等. 江西省耕地土壤有效态微量元素含量空间变异特征及其影响因素[J]. 长江流域资源与环境, 2018, 27(5): 1159-1169. DOI: 10.11870/cjlyzyyhj201805023 Jiang Y F, Zhong S, Rao L, et al. Spatial variability of soil available microelement contents of cultivated land in Jiangxi Province and their influencing factors[J]. Resources and Environment in the Yangtze Basin, 2018, 27(5): 1159-1169. DOI: 10.11870/cjlyzyyhj201805023
[32] 刘铮. 微量元素的农业化学[M]. 北京: 农业出版社, 1991. Liu Z. Agricultural chemistry of trace elements[M]. Beijing: Agricultural Press, 1991.
[33] 杨冬冬. 山东省典型地区氟和碘元素的地球化学特征[D]. 北京: 中国地质大学(北京)硕士学位论文, 2017. Yang D D. Geochemical characteristics of fluorine and iodine in typical areas of Shandong Province[D]. Beijing: MS Thesis of China University of Geosciences (Beijing), 2017.
[34] 王根志, 王秋霞. 微量元素与人体健康[J]. 微量元素与健康研究, 2004, 21(2): 54-56. DOI: 10.3969/j.issn.1005-5320.2004.02.028 Wang G Z, Wang Q X. Trace elements and human health[J]. Studies of Trace Elements and Health, 2004, 21(2): 54-56. DOI: 10.3969/j.issn.1005-5320.2004.02.028
[35] Mcgrath D, Zhang C, Carton O T. Geostatistical analyses and hazard assessment on soil lead in Silvermines Area, Ireland[J]. Environmental Pollution, 2004, 127(2): 239-248. DOI: 10.1016/j.envpol.2003.07.002
[36] 李珊, 张浩, 李启权, 等. 广元植烟土壤有效态微量元素的空间变异特征及影响因素[J]. 核农学报, 2016, 31(8): 1618-1625. Li S, Zhang H, Li Q Q, et al. Spatial variability of soil available microelement contents and their influencing factors in tobacco growing area in Guangyuan City[J]. Journal of Nuclear Agricultural Sciences, 2016, 31(8): 1618-1625.
[37] 孙剑虹, 张瑞庆, 王欢元, 等. 陕西定边盐渍土土壤含盐量和pH的空间分布特征[J]. 西北农业学报, 2014, 23(9): 114-119. Sun J H, ZhangR Q, Wang H Y, et al. Spatial variation of soil salt content and pH of salinized soil in Dingbian County, Shanxi Province[J]. Acta Agriculturae Boreali-Occidentalis Sinic, 2014, 23(9): 114-119.
[38] 雷志栋, 杨诗秀, 许志荣, 等. 土壤特性空间变异性初步研究[J]. 水利学报, 1985, (9): 10-21. DOI: 10.3321/j.issn:0559-9350.1985.09.002 Lei Z D, Yang S X, Xu Z R, et al. A preliminary study on spatial variability of soil characteristics[J]. Journal of Hydraulic Engineering, 1985, (9): 10-21. DOI: 10.3321/j.issn:0559-9350.1985.09.002
[39] 王政权. 地统计学及在生态学中的应用[M]. 北京: 科学出版社, 1999. Wang Z Q. Utilization of geostatistics in ecology sciences[M]. Beijing: Science Press, 1999.
[40] 朱静, 黄标, 孙维侠, 等. 农田土壤有效态微量元素的时空变化及其影响因素研究[J]. 南京大学学报(自然科学版), 2007, 43(1): 1-12. DOI: 10.3321/j.issn:0469-5097.2007.01.001 Zhu J, Huang B, Sun W X, et al. Temporal-spatial variability and its influencing factors of available trace metals in soils[J]. Journal of Nanjing University (Natural Science Edition), 2007, 43(1): 1-12. DOI: 10.3321/j.issn:0469-5097.2007.01.001
[41] 吴海勇, 李明德, 谷雨, 等. 硼肥不同施用方法及用量对水稻生长的影响[J]. 中国农学通报, 2017, 33(7): 5-8. Wu H Y, Li M D, Gu Y, et al. Different boron fertilizer application methods and amounts affecting rice growth[J]. Chinese Agricultural Science Bulletin, 2017, 33(7): 5-8.
[42] 六本木和夫, 蒋健容. 施用锰肥对水稻异常生育的改良效果[J]. 湖南农业大学学报(自然科学版), 1988, (4): 35-36. Liu B M H F, Jiang J R. Improvement effect of manganese fertilizer on abnormal rice growth[J]. Journal of Hunan Agricultural University (Natural Sciences Edition), 1988, (4): 35-36..
[43] 李文, 李伶俐, 王志强, 等. 喷施锌钼肥对渍涝胁迫玉米生长发育及产量和品质的影响[J]. 河南农业大学学报, 2016, 50(5): 593-597. Li W, Li L L, Wang Z Q, et al. Effect of spraying Zn and Mo fertilizers on corn growth and development, and yield & quality under waterlogging stresses[J]. Journal of Henan Agricultural University, 2016, 50(5): 593-597.
[44] 刘鹏, 杨玉爱. 硼钼胁迫对大豆叶片硝酸还原酶与硝态氮的影响[J]. 浙江大学学报(农业与生命科学版), 2000, 26(2): 151-154. Liu P, Yang Y A. The effect of the stress of boron and molybdenum on NR activity and contents of nitrate-N in leaves of soybean[J]. Journal of Zhejiang University (Agriculture & Life Science Edition), 2000, 26(2): 151-154.
[45] Fordyce F M, Zhang G, Green K, et al. Soil, grain and water chemistry in relation to human selenium-responsive diseases in Enshi District, China[J]. Applied Geochemistry, 2000, 15(1): 117-132. DOI: 10.1016/S0883-2927(99)00035-9
[46] 宋丰骥, 常庆瑞, 钟德燕, 等. 黄土丘陵沟壑区土壤微量元素空间变异特征及其影响因素[J]. 干旱地区农业研究, 2012, 30(1): 36-42. DOI: 10.3969/j.issn.1000-7601.2012.01.007 Song F J, Chang Q R, Zhong D Y, et al. Spatial variability and controlling factors of soil trace elements in hilly and gully area of the Loess Plateau[J]. Agricultural Research in the Arid Areas, 2012, 30(1): 36-42. DOI: 10.3969/j.issn.1000-7601.2012.01.007
[47] 张浩, 张新, 李启权, 等. 宜宾地区土壤有效态微量元素空间变异特征及影响因素[J]. 土壤通报, 2017, 48(03): 575-582. Zhang H, Zhang X, Li Q Q, et al. Spatial variability of soil available microelement and its influencing factors in Yibin[J]. Chinese Journal of Soil Science, 2017, 48(3): 575-582
[48] 张隆伟, 伍仁军, 王昌全, 等. 四川凉攀烟区植烟土壤有效铜和有效锌空间变异特征[J]. 中国烟草科学, 2014, 35(03): 1-6. Zhanf L W, Wu R J, Wang C Q, et al. Spatial variability characteristics of available Cu and Zn in tobacco planting soils in Liangshan and Panzhihua, Sichuan Province[J]. Chinese Tobacco Science, 2014, 35(3): 1-6.
[49] 谢忠雷, 郭平, 刘鹏, 等. 茶园土壤锰的形态分布及其影响因素[J]. 农业环境科学学报, 2007(02): 645-650. DOI: 10.3321/j.issn:1672-2043.2007.02.046 Xie Z L, Guo P, Liu P, et al. Fr actionation and its affecting factor s of manganese in tea garden soils[J]. Journal of Agro-Environment Science, 2007, 26(2): 645-650. DOI: 10.3321/j.issn:1672-2043.2007.02.046
[50] 刘学军, 廖晓勇, 张扬珠, 等. 不同稻作制对红壤性水稻土中锰剖面分布的影响[J]. 生态学报, 2002, 22(09): 1440-1445. DOI: 10.3321/j.issn:1000-0933.2002.09.011 Liu X J, Liao X Y, Zhang Y Z, et al. Effects of rice-based cropping system on distribution of manganese in the prof ile of paddy soil derived from red earth[J]. Acta Ecologica Sinica, 2002, 22(9): 1440-1445. DOI: 10.3321/j.issn:1000-0933.2002.09.011
[51] 梁东丽, 彭琴, 崔泽玮, 等. 土壤中硒的形态转化及其对有效性的影响研究进展[J]. 生物技术进展, 2017, 7(5): 374-380. Liang D L, Peng Q, Cui Z W, et al. Progress on selenium bioavailibility and influential factors in soil[J]. Current Biotechnology, 2017, 7(5): 374-380.
[52] 周墨, 陈国光, 张明, 等. 赣南地区土壤硒元素地球化学特征及其影响因素研究: 以青塘-梅窖地区为例[J]. 现代地质, 2018, 32(06): 1292-1301. Zhou M, Chen G G, Zhang M, et al. Geochemical characteristics and influencing factors of selenium in soils of south Jiangxi Province: a typical area of Qingtang-Meijiao[J]. Geoscience, 2018, 32(6): 1292-1301.
[53] 江厚龙, 张保全, 李钠钾, 等. 重庆植烟土壤有效养分含量及其影响因素[J]. 中国烟草科学, 2014, 35(05): 67-73. Jiang H L, Zhang B Q, Li N J, et al. Soil available nutrient contents and their influencing factors in tobacco crowing region in Chongqing[J]. Chinese Tobacco Science, 2014, 35(5): 67-73.
-
期刊类型引用(16)
1. 张世文,李恩伟,孔晨晨,祝亚飞,胡睿鑫. 土壤-西甜瓜系统中硒的空间分布特征及其与环境因子的关系. 安徽科技学院学报. 2024(03): 48-57 .  百度学术
百度学术
2. 王妍,邬磊,李建兵,王军,曲潇琳,崔萌,郭玉明,张文菊. 我国主要粮食产区土壤有效态钙镁硫的变化特征及其对作物产量的影响. 中国土壤与肥料. 2024(03): 209-217 . 百度学术
3. 李慧,温汉辉,蔡立梅,徐耀辉,罗杰,梅敬娴,徐述邦. 广东省揭阳市揭东区微量元素分布特征及其影响因素分析. 现代地质. 2023(01): 208-216 . 百度学术
4. 刘洋,李廷亮,栗丽,张晋丰,陈婷. 山西省3种典型作物主产区土壤微量元素特征分析. 灌溉排水学报. 2023(03): 40-47 . 百度学术
5. 李朋飞,吴衡,管后春,徐锦龙,王耀,沈仕豪,汪雅菲,葛海影. 淮北平原农用地土壤钼测定与分布特征及影响因素. 岩矿测试. 2023(02): 361-370 . 百度学术
6. 张文学,王少先,金伟,徐丽萍,唐先干,熊丽,王萍,夏文建,刘增兵,孙刚,李祖章,刘光荣,邵彩虹. 有机无机氮肥比例对稻田土壤肥力和作物产量的短期效应. 植物营养与肥料学报. 2023(07): 1300-1312 . 本站查看
7. 贺军奇,拜寒伟,徐轶玮,倪莉莉. 陕西黄土区农田土壤主要养分特征及影响因素. 干旱区研究. 2023(12): 1907-1917 . 百度学术
8. 张宁宁,许佳聪,田仓,严加坤,亢福仁. 不同土地利用对黄土丘陵区小流域土壤微量元素的影响. 榆林学院学报. 2022(02): 19-24 . 百度学术
9. 裴佳晨,杨良波,刘冬碧,赵越,朱建强,吴茂前,余延丰,郑兴汶,唐记平,揭志辉. 江西省广昌县莲田土壤中、微量元素含量及空间变异性评价. 中国蔬菜. 2022(03): 50-57 . 百度学术
10. 王学寅,黄益灵,全斌斌,林道秀,韩振春. 浙江省瑞安市耕作层土壤养分元素有效态含量空间变异特征及其影响因素. 现代地质. 2022(03): 963-971 . 百度学术
11. 曾美云,何启生,邵鑫. 全自动石墨消解-电感耦合等离子体质谱法测定土壤中22种微量元素. 华南地质. 2022(02): 350-357 . 百度学术
12. 张文学,王少先,刘增兵,唐先干,熊丽,夏文建,王萍,袁福生,孙刚,李祖章,刘光荣. 基于土壤肥力质量综合指数评价化肥与有机肥配施对红壤稻田肥力的提升作用. 植物营养与肥料学报. 2021(05): 777-790 . 本站查看
13. 王珊,于帅,刘娜. 土壤有效态微量元素的影响因素分析. 农业科技通讯. 2021(09): 82-84 . 百度学术
14. 任科羽,夏卫生,周浩,杨云帆,童星星,王欣. 不同水稻降镉技术对微量元素含量影响研究. 土壤通报. 2021(05): 1210-1219 . 百度学术
15. 熊凯,赵玉娟,陈健,张运,赵广东,杨洪国,史作民,许格希. 川西米亚罗亚高山原始暗针叶林土壤微量元素的空间变异性分析. 林业科学研究. 2021(06): 99-106 . 百度学术
16. 张璐,蔡泽江,王慧颖,于子坤,韩天富,柳开楼,刘立生,黄晶,文石林,张会民. 中国稻田土壤有效态中量和微量元素含量分布特征. 农业工程学报. 2020(16): 62-70 . 百度学术
其他类型引用(13)

计量
- 文章访问数: 3374
- HTML全文浏览量: 1393
- PDF下载量: 108
- 被引次数: 29
