
Combined appilcation of controlled-release nitrogen fertilizer and water-soluble fertilizer to reduce N2O emission in greenhouse soil
-
摘要:目的
控制N2O排放是提高氮肥利用和环境效益的一个重要任务。在滴灌条件下,研究以控释氮肥替代尿素基施减少设施土壤N2O排放的机制,并探讨减少氮肥投入的可能性。
方法在大棚内布设小区试验,供试番茄品种为‘盛世辉煌’,氮肥40%基施,60%分3次随水滴灌追施。试验以不施氮肥为对照 (CK),设:常规化肥用量 (基施尿素,总N量440 kg/hm2,U);常规化肥用量减氮20% (基施尿素,总N量376 kg/hm2,–20%U);控释氮肥常规用量 (基施控释氮肥,总N量440 kg/hm2,CRU);控释氮肥常规用量减氮20% (基施控释氮肥,总N量376 kg/hm2,–20%CRU) 4个处理。施底肥后15天内每天取气体样1次;追肥后每2天取气体样1次,连续取样3次;其余时间间隔5~7天取气体样1次。静态箱–色谱法测定土壤N2O排放通量;在定植后40、80和120天取土样测定土壤理化性质;用实时荧光定量PCR检测相关功能基因数量变化;收获后测产。
结果控释氮肥与水溶肥配施导致基肥N2O排放峰值出现时间从第8~13天延迟到第28~32天,并且显著降低了其N2O排放峰值,所有处理追水溶肥后均在3~5天出现N2O排放峰值,而控释氮肥与水溶肥配施降低了此阶段N2O排放峰值。相同氮肥施用量条件下,控释氮肥与水溶肥配施显著降低了基肥期土壤N2O排放通量和累积排放量,降低了追肥期土壤N2O排放通量和累积排放量,显著降低了番茄生长季土壤NH4+-N和NO3−-N含量与微生物功能基因AOA amoA、AOB amoA和nirK数量,降低了nirS数量。与U处理相比,CRU处理增加番茄产量和经济效益,生长季土壤N2O累积排放量减少了24.8%,差异显著,同时显著降低了N2O排放强度;与–20%U处理相比,–20%CRU处理增加番茄产量和经济效益,N2O累积排放量减少了22.1%,亦显著降低了N2O排放强度 (P < 0.05)。
结论在常规用氮量和减氮20%用量下,以缓释氮肥代替尿素基施,不仅可显著增加番茄的产量和效益,还显著推迟了番茄生长初期N2O释放高峰的出现,减少了整个生育期N2O的排放强度和累积排放量。其主要原因在于缓释氮肥有效控制了土壤中NH4+-N和NO3−-N含量的变化,进而减少了与硝化和反硝化相关的微生物数量。在使用缓释肥做基肥时,适当减少氮肥投入不会降低番茄的产量。
Abstract:ObjectivesControlling N2O emission is an important task in nitrogen management during crop production. Under drip irrigation condition, we studied the mechanism of controlled release fertilizer reducing N2O emission, and the possibility of reducing total nitrogen input through replacement of basal applied urea by controlled-release fertilizer.
MethodsA micro-plot field experiment was conducted inside greenhouse for consecutive three years, using tomato cultivar of 'Shengshihuihuang' as test material. 40% of nitrogen were basal applied before transplanting and 60% were top dressed with drip irrigation. Five treatments included no nitrogen input control (CK), routine N rate with urea basal applied (N 440 kg/hm2, U), 20% less N input with urea basal applied (N 376 kg/hm2, –20%U), routine N rate with controlled-release fertilizer basal applied (N 440 kg/hm2, CRU) and 20% less N input with CRU basal applied (N 376 kg/hm2, –20%CRU). Within the 15 days of basal application, soil gas samples were collected every day, within 8 days of each topdressing, the gas sample were collected every other days and collected three times, and the N2O emission flux was measured by static box-chromatography method. Soil samples were collected at the 40, 80 and 120 days after transplanting, and soil physical and chemical properties were measured using conventional methods, and the number of related microbe and functional genes were measured by real-time fluorescence quantitative method. At harvest, the tomato yields were investigated and the nitrogen contents were determined.
ResultsCompared with U treatment, CRU treatments postponed the appearance of peak N2O emission after basal fertilization from 8–13 days to 28–32 days, and significantly reduced peak emission flux. After topdressing, the peak emission occurred in 3–5 days in all treatments, while the two CRU treatments reduced the peak N2O emission flux. Under the same amount of N input, the CRUs significantly reduced N2O emission flux and NO3– accumulation in soil during basal and topdressing fertilizer stages. The total soil N2O emission was significantly reduced by 24.8% in CRU treatment, and by 22.1% in –20%CRU treatment during the whole growing season; the content of NH4+-N and NO3−-N and the number of AOA amoA, AOB amoA and nirK were significantly reduced, the number of nirS was also reduced during growing season. Compared with U treatment, the yield and economic benefit of tomato were significantly increased in CRU treatment, and the yield in –20%U treatment was not changed significantly, while the economic benefit were increased.
ConclusionsReplacing urea with controlled-release fertilizer as basal fertilizer could significantly delay the appearance of peak N2O emission and emission intensity at the early stage of tomato growth, and reduce more than 20% of total N2O emission during the whole growth period. The reason for it is the decreased NH4+-N and NO3−-N contents and the number of microbial related to nitrification and denitrification in soil. The total nitrogen fertilizer input could be properly reduced if use slow-release fertilizer as basal fertilizer in tomato under drip irrigation.
-
Keywords:
- N2O emission /
- N2O emission intensity /
- greenhouse soil /
- AOA amoA /
- AOB amoA /
- nirK /
- nirS
-
氧化亚氮 (N2O) 是大气中最主要的温室气体之一,对全球变暖的总贡献率可达到6%[1]。农业系统每年向大气中排放的N2O约占全球人为排放总量的60%,成为重要的N2O排放源[2]。随着我国农业供给侧改革和蔬菜需求量增长,设施蔬菜种植面积逐年增加,到2016年设施菜田超过400万hm2,成为我国农业生态系统主要组成部分。设施菜田高水氮投入导致土壤酸化、硝态氮积累[3-4]及土壤生物组成改变[5-6],对设施土壤生态系统产生不利影响。设施菜地生态系统高温、高湿环境有利于土壤矿化作用、硝化作用和反硝化作用等各种土壤氮素转化反应的发生[7-9],为土壤N2O的产生创造了有利条件;同时高氮肥的施入会给微生物的活动提供反应底物,从而加速N2O的产生与释放[10],导致我国设施蔬菜土壤N2O排放量占到农业系统排放总量的10%~12%[11],成为我国农业温室气体排放重要排放源和增加源。因此,我国设施土壤N2O减排对减缓全球气候变化具有重要意义。
氮素在农业生产中起着重要作用,是作物产量提升的关键驱动力。农田系统中50%的N2O排放量与土壤氮肥的施用有关[12]。氮肥施入后土壤中NH4+和NO3−浓度迅速增加,作为土壤硝化和反硝化作用的主要底物,其迅速增加必然导致硝化和反硝化过程加剧,进而使其产物N2O产生量增加。国内外众多研究均表明,控释氮肥可以调控尿素溶出,降低硝化微生物amoA基因及反硝化nirS、nirK基因数量[13],在减少大田和菜田氮素损失和促进作物生长方面作用效果显著[5, 14]。Bruce等[15]基于大数据的Meta分析结果表明,缓控氮肥在一定程度上降低土壤N2O排放;Gao等[16]通过大田和盆栽控制试验发现,缓控释氮肥处理,玉米–小麦轮作系统土壤的N2O排放降低了32.1%;朱永昶等[17]研究证实水稻和玉米田施加缓控释氮肥后均显著降低了土壤N2O排放通量;Tian等[18]研究发现控释氮肥不仅增加产量,而且降低灌溉期N2O排放。而当前关于控释氮肥对设施菜田土壤N2O排放研究较少[8],因此加强该方面的系统研究,为设施土壤N2O减排提供依据。
当前设施蔬菜种植主要是采用有机肥和化肥作为底肥,生长期追加水溶肥的施肥模式,这种施肥方式导致土壤N2O排放峰主要出现在底肥施加后5~10天和追肥后的3~5天[19],特别是在生长季前期,由于有机肥和尿素的底施使得该时期N2O排放峰值占全年排放总量的50%以上,因此,减少氮肥底施期N2O排放成为设施N2O减排的关键。目前,关于减少设施农田土壤N2O排放的研究主要集中在氮肥减量、尿素与硝化抑制剂配施等方面[8, 20-22],而关于控释氮肥替代普通尿素,后期追加水溶肥配施这种模式对设施农田土壤N2O排放影响的研究还比较少。为此,本研究基于连续3年的设施菜田定位试验,研究控释氮肥 (作为底肥) 与水溶肥配施模式下土壤N2O排放动态、N2O排放强度、土壤理化性质及土壤微生物的变化,探明控释氮肥与水溶肥配施对设施菜地土壤N2O排放的影响及其影响因素,为设施农田土壤N2O减排提供依据,同时也是我国设施农业可持续发展需要。
1. 材料与方法
1.1 试验设计
试验地点为北京延庆绿富隆农业园内温室 (N 40°30′15″、E 116°05′45″)。种植作物为番茄‘盛世辉煌’,2018年3月14日移栽,生长期120天。种植模式为春茬种植番茄,秋冬茬种植油麦菜、生菜等叶菜。试验土壤基础理化性质:pH = 7.6、有机碳27.4 g/kg、全氮3.1 g/kg、NO3–-N 53.3 mg/kg、NH4+-N 2.3 mg/kg、有效磷186 mg/kg、速效钾342 mg/kg。试验共设5个处理,分别为不施氮对照 (CK)、化肥常规用量 (U)、化肥常规用量减氮20% (–20%U)、控释氮肥常规用量 (CRU)、控释氮肥常规用量减氮20% (–20%CRU)。每个处理4个重复 (小区),共20个小区。每个小区面积为15 m2 (3 m × 5 m),小区间隔0.5 m,随机区组排列。除对照外,所有处理基施有机肥N 120 kg/hm2,P2O5 100 kg/hm2和钾肥K2O 300 kg/hm2。化肥常规用量为N 320 kg/hm2,减氮20%处理总化肥氮量为256 kg/hm2。总氮肥量的40%基施,60%追施。化肥处理基施氮肥为尿素,控释氮肥处理中的基施氮肥由尿素改为控释尿素 (北京市农林科学院植物营养与资源研究所研制,释放周期60天,含氮42.0%),追施肥4个处理一致。在番茄定植后的42、72和87天分别进行第1次、第2次与第3次的水溶肥追肥,分别对应追高氮水溶肥 (N∶P2O5∶K2O = 30∶10∶10)、高钾水溶肥 (N∶P2O5∶K2O = 15∶5∶30)、高氮水溶肥,追肥随滴灌进行。减肥处理中,按照常规用量,所有基肥和3次追施都减少20%,具体施肥量见表1。
表 1 各处理具体氮肥和用量 (N kg/hm2)Table 1. Details of nitrogen application amount in each treatment处理
Treatment基肥 Base fertilizer 追肥 Topdressing 有机肥Manure 化肥Chemical 第1次 First time 第2次 Second time 第3次 Third time CK 0 0 0 0 0 U 120.0 128.0 76.8 38.4 76.8 –20%U 120.0 102.4 61.4 30.7 61.4 CRU 120.0 128.0 76.8 38.4 76.8 –20%CRU 120.0 102.4 61.4 30.7 61.4 注(Note):U—尿素 Urea;CRU—控释尿素 Controlled-release urea. 1.2 土样采集
在番茄定植后40、80、120天进行土壤取样。取样方法为每个小区按照‘S’字型取样,用直径3.0 cm土钻取土壤,土壤取样深度为0—20 cm,每个小区用土钻取5钻充分混匀后作为一个样品,土壤样品分为三部分,一部分用于分析土壤理化性状,一部分于4℃冰箱保存用于检测NH4+-N和NO3–-N含量,一部分于–80℃冰箱保存用于微生物数量分析。
1.3 测定方法
利用pH计测定土壤pH (PHS-3C型,上海仪电科学仪器有限公司,水土比5∶1);有机碳采用元素分析仪 (Vario EI,Elementar,German) 测定;全氮采用半微量凯氏定氮法测定;NH4+-N和NO3–-N采用流动分析仪 (Auto Analyzer 3,SEAL,German) 检测。
利用实时荧光定量PCR仪 (7500 Real Time PCR System,Applied Biosystem,USA) 对硝化反应功能基因 (amoA) 和反硝化功能基因 (nirS、nirK) 的保守区进行扩增,目标基因和引物见表2。
表 2 标靶基因和荧光定量PCR引物Table 2. Target genes and primers used in fluorescent quantitative PCR基因Gene 引物 Specific primer sequences AOA amoA Arch amoA F 5′-STAATGGTCTGGCTTAGACG-3′
Arch amoA R 5′-GCGGCCATCCATCTGTATGT-3′AOB amoA amoA-1 F 5′-GGGGTTTCTACTGGTGGT-3′
amoA-2 R 5′-CCCCTCKGSAAAGCCTTCTTC-3′nirS nirS4 F 5′-TTCRTCAAGACSCAYCCGAA-3′
nirS6 R 5′-CGTTGAACTTRCCGGT-3′nirK F1aCu 5′-ATCATGGTSCTGCCGCG-3′
R3Cu 5′-GCCTCGATCAGRTTGTGGTT-3′采用静态箱法收集气体样品。静态箱采用不透明的PVC板制作,其规格为长50 cm、宽50 cm、高54 cm。测定前24 h将水槽底座插入土壤中5 cm,取样时将静态箱置于水槽底座中形成密闭空间,分别在0、5、15、30 min后用密封气瓶收集箱内气体。具体取样时间为:施底肥后15天内,每天取样1次;追肥后每2天取样1次,连续取样3次;其余时间间隔5~7天取样1次。取样时间均为上午9:00—11:00。采用GC-ECD法测定样品中的N2O浓度。气相色谱仪为HP7890N,由Agilent公司提供,测定温度为330℃,色谱柱为PorpakQ,柱温70℃,载气为高纯N2,每检测10个样品使用标准气体标定气相色谱仪,测定的相对误差控制在2 %以内。
N2O排放通量计算公式:
F=ρ×VA×ΔCΔt×275273+T 式中,F表示N2O排放通量[µm/(m2·h) ];ρ表示标准状态下N2O-N的密度;V为采样箱体积 (m3);A为采样水槽底座内土壤表面积 (m2);∆C/∆t表示气体的排放速率,即对每个小区每次采集的4个样品的气体浓度与时间进行的线性回归,回归方程的系数就是∆C/∆t;T为采样箱内温度 (℃)。N2O累积排放量计算公式:
CF=n∑i=1(Fi+1+Fi2)×(ti+1−ti)×24×f 式中,CF为N2O气体的累积排放量 (N kg/hm2);Fi为第i次测定N2O气体的排放通量;24为每天排放通量换算系数;(ti+1–ti) 为连续2次测定间隔天数;n为观测总次数;f为单位换算系数10–5。
N2O排放强度计算公式:EI = I/Y
式中,N2O排放强度EI是单位产量的N2O排放量 (N kg /t);I为N2O排放总量 (N kg/hm2);Y为番茄产量 (t/hm2)。
1.4 数据处理
数据采用SPSS 22.0软件进行单因素方差分析 (one-way analysis of variance),差异显著性水平为0.05水平,数据均为平均数 ± 标准误。
2. 结果与分析
2.1 不同处理对番茄产量和经济效益的影响
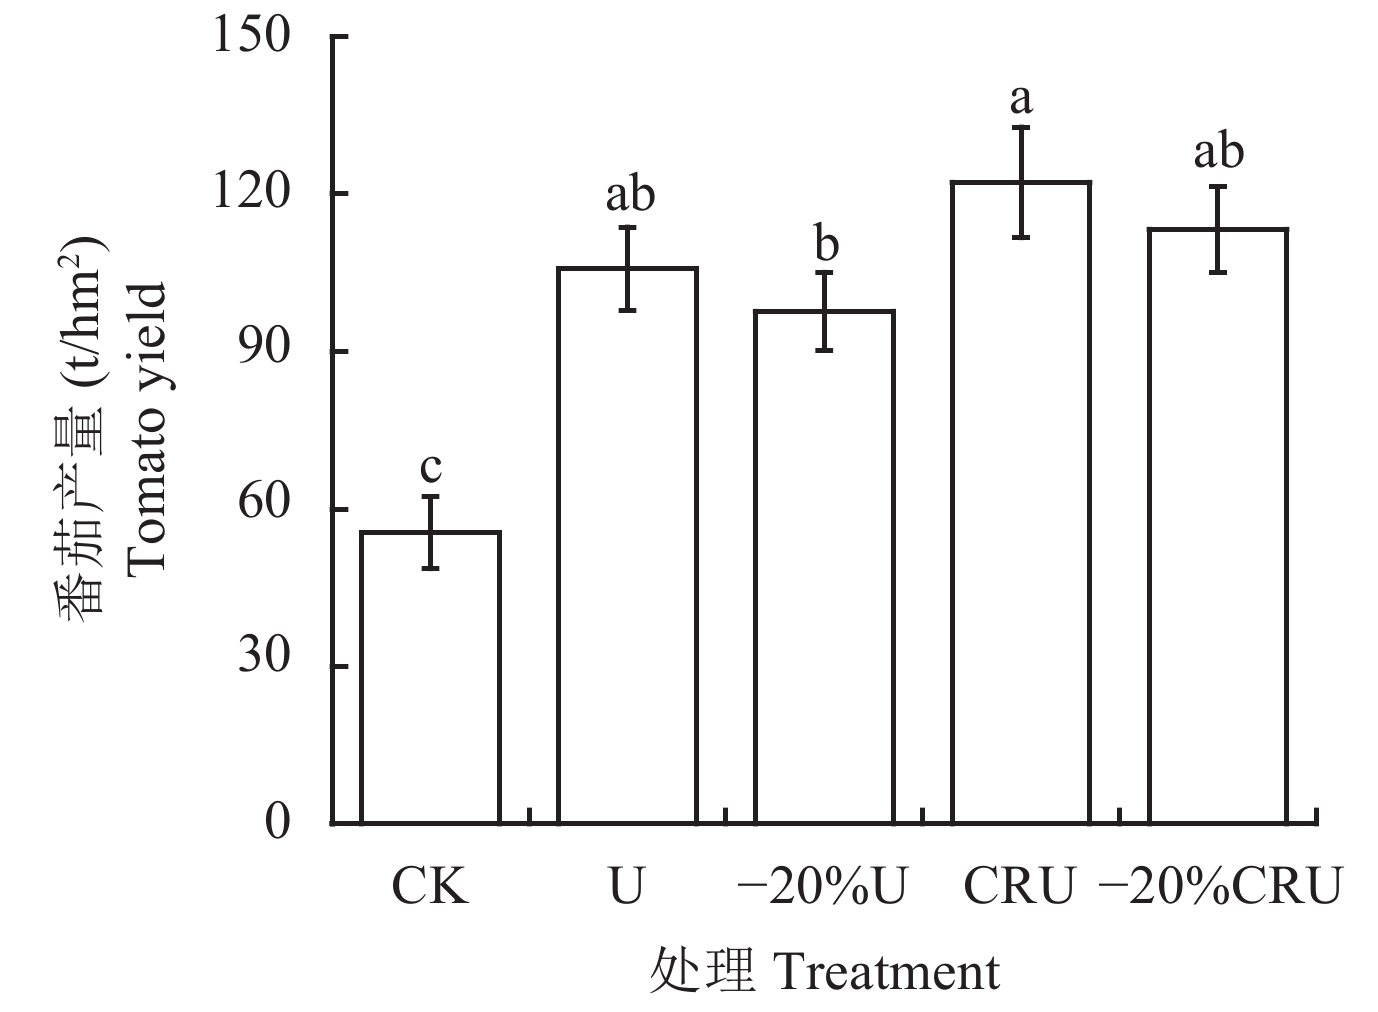
图1可见,与U处理相比,CRU处理番茄产量增加了20.2%;与–20%U处理相比,–20%CRU处理番茄产量增加了15.0%,均未达到显著水平 (P > 0.05),控释氮肥显示出增产趋势。
![]() 图 1 不同处理番茄产量[注(Note):U—尿素Urea;CRU—控释尿素Controlled-release urea. 柱上不同小写字母表示处理间差异显著Different lowercase letters indicate significant difference among treatments at 0.05 level.]Figure 1. Tomato yield under different treatments
图 1 不同处理番茄产量[注(Note):U—尿素Urea;CRU—控释尿素Controlled-release urea. 柱上不同小写字母表示处理间差异显著Different lowercase letters indicate significant difference among treatments at 0.05 level.]Figure 1. Tomato yield under different treatments设施番茄经济效益5个处理呈现为CRU > –20%CRU > U > –20%U > CK (表3)。其中,与U处理相比,CRU处理经济效益提高了15.5%;与–20%U处理相比,–20%CRU处理经济效益提高了16.6%,因此,与底肥施用尿素处理相比,控释氮肥水溶肥配施处理提高了设施番茄经济效益。–20%U处理与U处理相比,经济效益降低了8.2%,与CRU相比,经济效益降低了20.5%,由此,减氮20%在一定程度上降低了番茄经济效益。
表 3 不同处理番茄经济效益 (yuan/hm2)Table 3. Economic benefits of tomato production under different treatments处理
Treatment产值
Output肥料投入Fertilizer input 经济效益
Economic
benefit商品有机肥
Commercial
organic fertilizer钾肥
Potassium
fertilizer磷肥
Phosphorous
fertilizer水溶肥
Soluble
fertilizer氮肥
Nitrogen
fertilizerCK 233016 9000 0 0 0 0 233016 U 423120 9000 1670 577 4608 696 406569 –20%U 390600 9000 1756 605 3686 557 373153 CRU 488840 9000 1670 577 4608 1067 469614 –20%CRU 463040 9000 1756 605 3686 853 445297 注(Note):U—尿素 Urea;CRU—控释尿素 Controlled-release urea. 商品有机肥价格 The price of commercial organic fertilizer:600 yuan/t;尿素价格 The price of urea:2500 yuan/t;控释尿素 The price of controlled-release N fertilizer:3500 yuan/t;水溶肥价格 The price of water-soluble fertilizer:20 yuan/kg;单项磷肥 The price of phosphate fertilizer [Ca (H2PO4) 2 14%]:1000 yuan/t;单项钾肥价格 Potash fertilizer price (K2SO4,50%):3500 yuan/t;番茄价格 Tomato price:4.0 yuan/kg. 2.2 土壤N2O排放动态变化
基肥期,U和–20%U处理N2O排放峰出现在8~13天,而CRU和–20%CRU处理的N2O排放峰出现在28~32天 (图2)。追肥后,U、–20%U、CRU、–20%CRU处理N2O排放峰均出现在3~5天 (图2)。
![]() 图 2 不同处理N2O排放通量动态变化[注(Note):U—尿素Urea;CRU—控释尿素Controlled-release urea.Figure 2. Dynamics changes of N2O emission fluxes under different treatments
图 2 不同处理N2O排放通量动态变化[注(Note):U—尿素Urea;CRU—控释尿素Controlled-release urea.Figure 2. Dynamics changes of N2O emission fluxes under different treatments生长初期 (定植后0~40天,追肥前),U和–20%U处理N2O平均排放通量分别显著高于CRU和–20%CRU处理 (P < 0.05) (图3);与U处理相比,–20%U处理土壤N2O平均排放通量降低了16.8%,CRU处理降低了44.0% (P < 0.05);与–20%U处理相比,–20%CRU处理N2O平均排放通量降低了29.5% (P < 0.05)。生长中期 (定植后40~80天),与U处理相比,–20%U和CRU处理土壤N2O平均排放通量分别降低了10.6%和17.6%,差异不显著;与–20%U相比,–20%CRU处理N2O平均排放通量降低了14.2%,差异也未达到显著。生长末期 (80~120天),与U处理相比,–20%U和CRU处理土壤平均N2O排放通量降低了9.3%和13.0%,差异不显著;与–20%U处理相比,–20%CRU处理N2O平均排放通量降低了13.0%,差异也未达到显著。
![]() 图 3 不同处理番茄各生长期土壤N2O排放通量与累积排放量[注(Note):柱上不同小写字母表示处理间差异显著Different lowercase letters above the bars indicate significant difference among treatments at 0.05 level.]Figure 3. N2O emission fluxes and N2O accumulation emissions at different growth period of tomato under different treatments
图 3 不同处理番茄各生长期土壤N2O排放通量与累积排放量[注(Note):柱上不同小写字母表示处理间差异显著Different lowercase letters above the bars indicate significant difference among treatments at 0.05 level.]Figure 3. N2O emission fluxes and N2O accumulation emissions at different growth period of tomato under different treatments不同处理N2O累积排放量变化趋势与其排放通量变化趋势一致。番茄生长初期 (0~40天),与U处理相比,–20%U处理N2O排放积累量降低了17.3%,CRU处理降低了31.8% (P < 0.05);与–20%U相比,–20%CRU处理N2O累积排放量降低了29.0% (P < 0.05) (图3)。生长中期 (40~80天),与U处理相比,–20%U和CRU处理土壤N2O累积排放量分别降低了9.8%和18.1%;与–20%U相比,–20%CRU处理N2O累积排放量降低了15.8%。生长末期 (80~120天),与U处理相比,–20%U和CRU处理N2O累积排放量降低了8.1%和9.6%;与–20%U相比,–20%CRU处理N2O累积排放量降低了16.1%。因此,控释氮肥与水溶肥配施及减氮20%降低了N2O排放通量和N2O累积排放量。
整个番茄生长季,N2O累积排放量、N2O排放强度表现出相同趋势,均呈现为CK < –20%CRU < CRU < –20%U < U (表4)。与U相比,–20%U处理降低了N2O累积排放量、N2O排放强度,差异不显著,CRU处理显著降低了N2O累积排放量和排放强度 (P < 0.05)。与–20%U相比,–20%CRU处理显著降低了N2O累积排放量和排放强度 (P < 0.05)。因此,控释氮肥与水溶肥配施及减氮20%均降低了N2O累积排放量和N2O排放强度。
表 4 不同处理下土壤N2O累积排放量和排放强度Table 4. N2O emission accumulation and emission intensity of N2O under different treatments处理
Treatment累积排放量(N kg/hm2)
Cumulative emission排放强度(N g/t)
Emission intensityCK 1.62 ± 0.11 d 29.24 ± 1.23 b U 5.23 ± 0.39 a 49.31 ± 2.51 a –20%U 4.52 ± 0.35 ab 46.15 ± 1.83 a CRU 4.19 ± 0.37 bc 34.27 ± 1.92 b –20%CRU 3.70 ± 0.25 c 33.33 ± 1.64 b 注(Note):同列数值后不同小写字母表示处理间差异显著 (P < 0.05) Values followed by different lowercase letters indicate significant difference among treatments at 0.05 level. 2.3. 土壤理化性质与微生物功能基因变化
不同处理土壤pH变化不明显 (表5)。与CK处理相比,U、–20%U、CRU、–20%CRU处理显著增加了土壤有机碳、全氮、NH4+-N和NO3–-N含量 (P < 0.05)。与U相比,–20%U、CRU处理显著降低了NH4+-N和NO3–-N含量 (P < 0.05)。
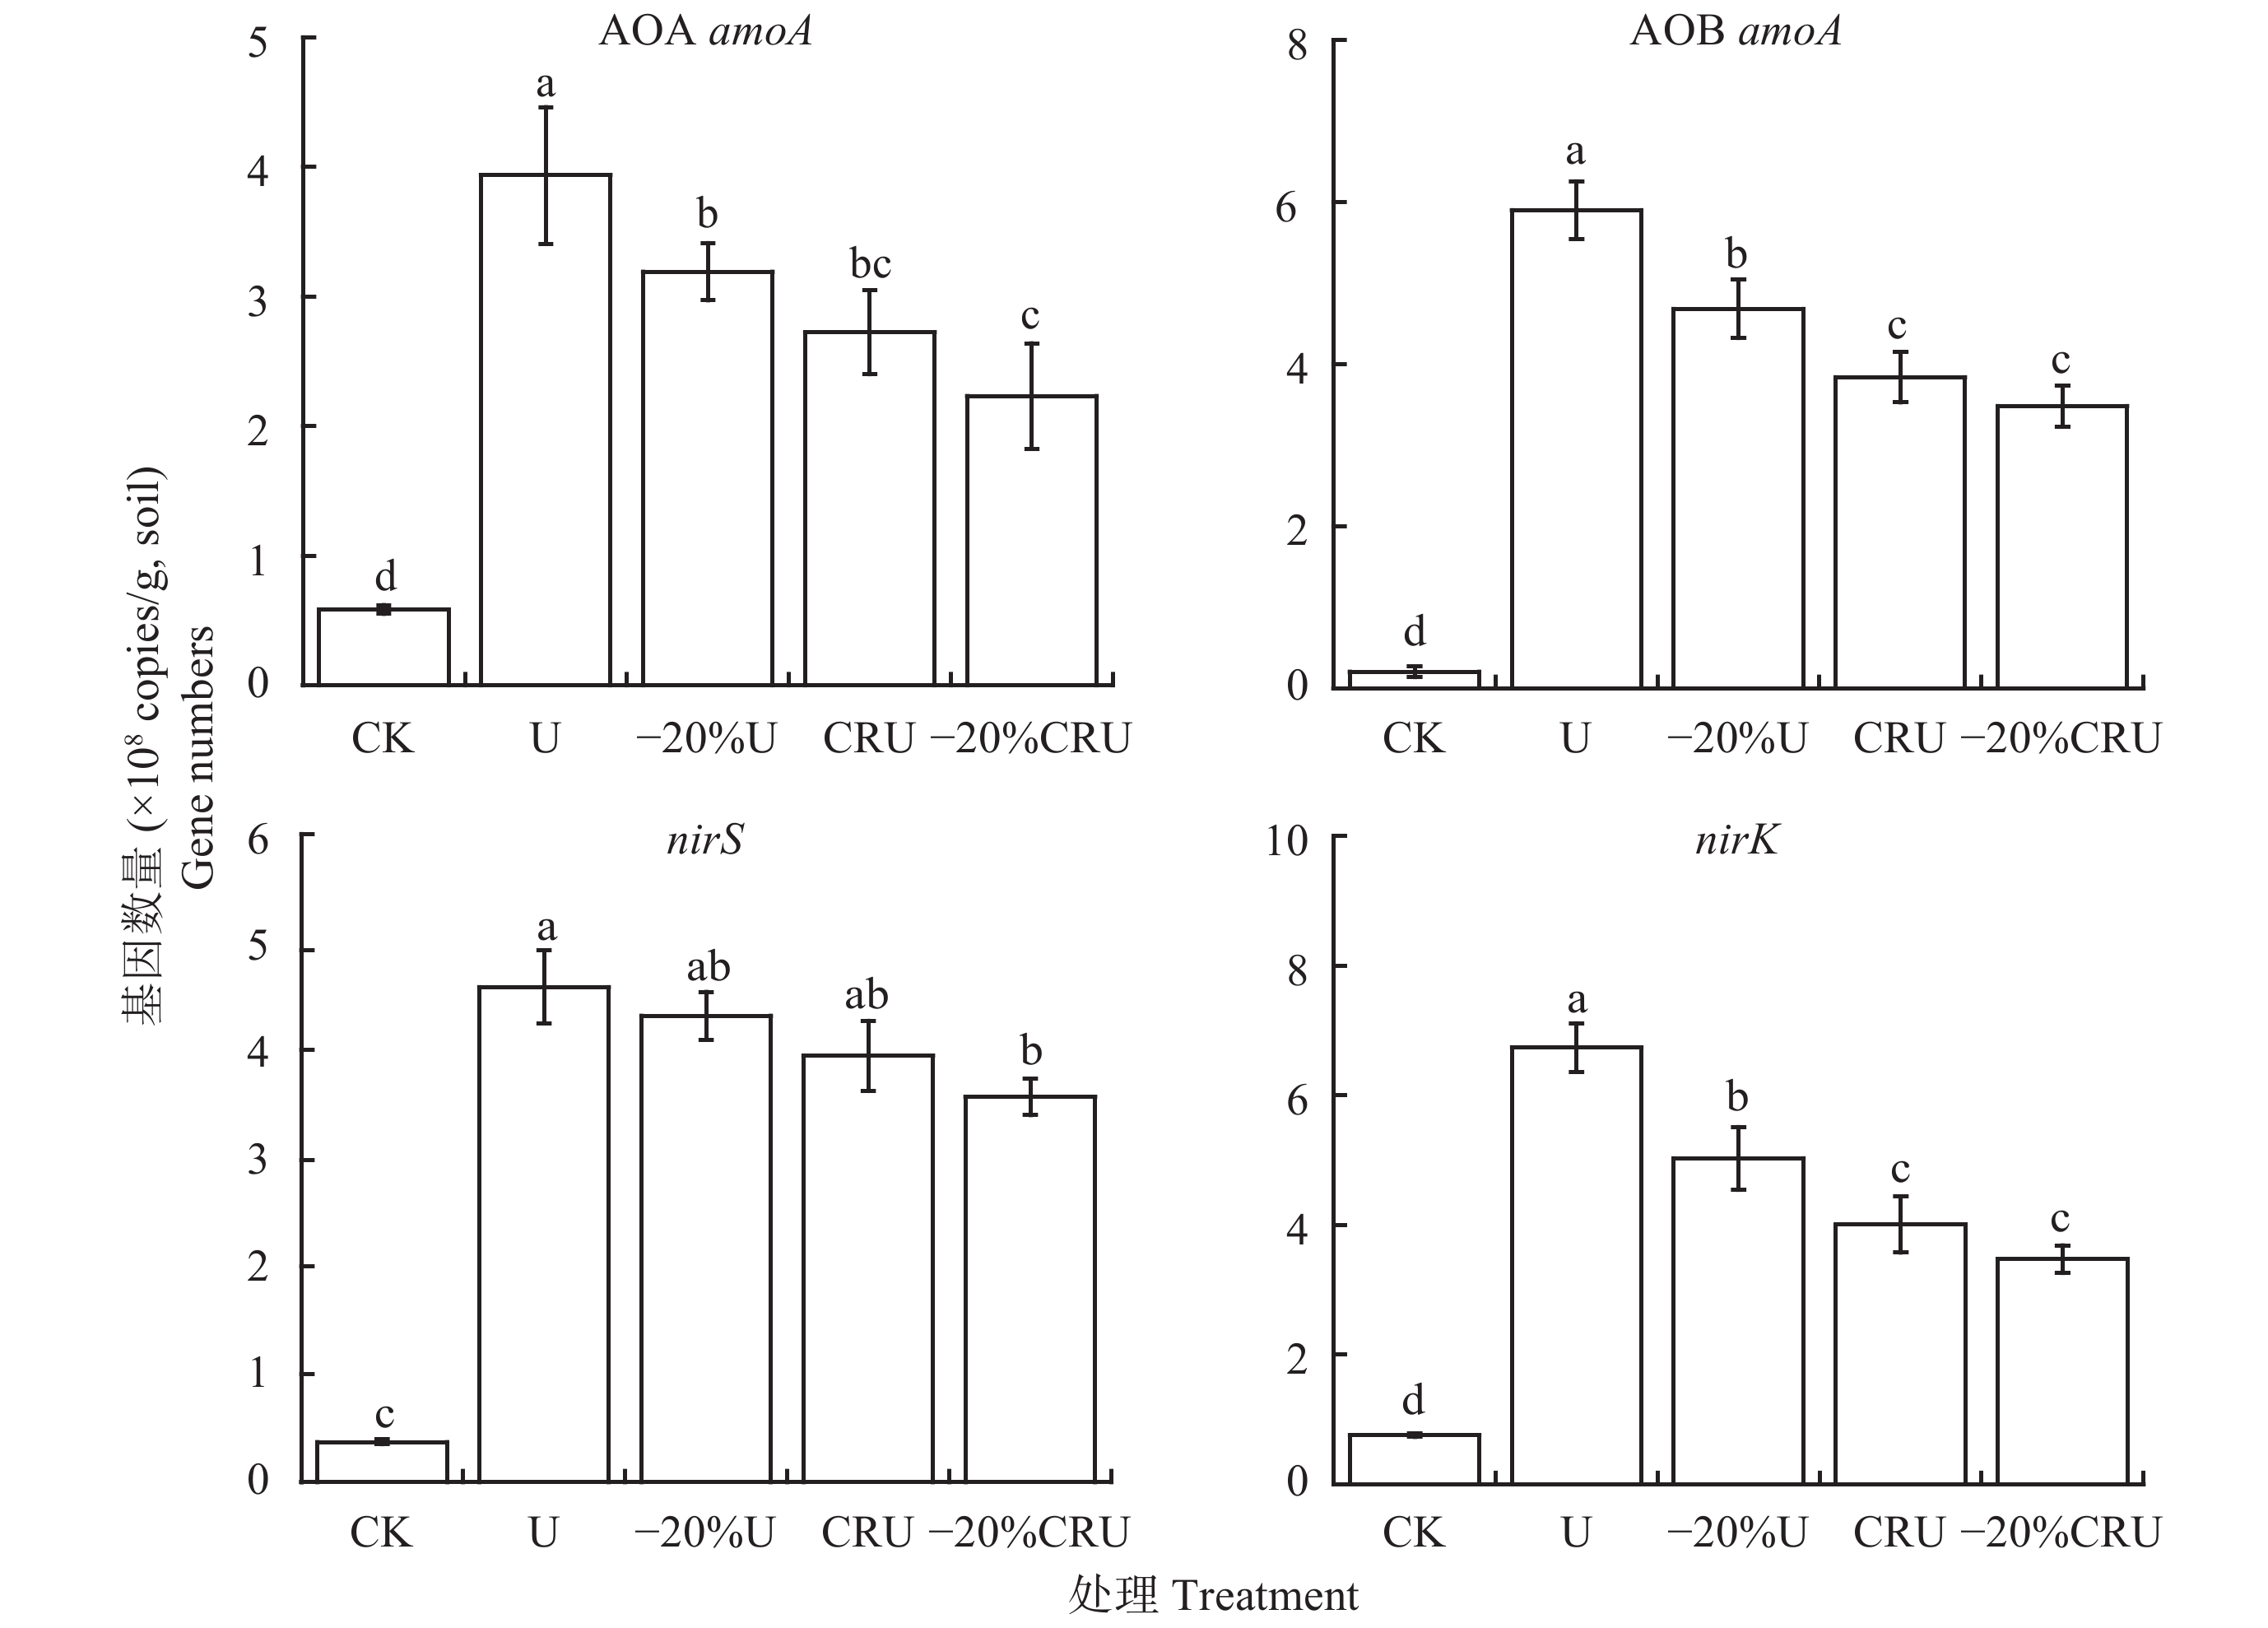
表 5 不同处理下土壤理化性质Table 5. Soil physical and chemical properties under different treatments处理Treatment pH 有机碳SOC (g/kg) 全氮Total N (g/kg) NO3–-N (mg/kg) NH4+-N (mg/kg) CK 7.53 ± 0.03 a 12.59 ± 0.65 b 1.74 ± 0.06 b 11.98 ± 0.69 e 0.60 ± 0.14 d U 7.50 ± 0.02 a 28.90 ± 1.88 a 3.39 ± 0.16 a 82.58 ± 2.69 a 3.73 ± 0.28 a –20%U 7.54 ± 0.02 a 30.69 ± 1.10 a 3.17 ± 0.15 a 62.69 ± 3.48 b 2.75 ± 0.14 b CRU 7.53 ± 0.04 a 31.57 ± 1.78 a 3.48 ± 0.19 a 55.93 ± 3.58 c 2.42 ± 0.16 bc –20%CRU 7.57 ± 0.02 a 28.51 ± 1.65 a 3.19 ± 0.18 a 48.47 ± 2.11d 2.24 ± 0.13 c 注(Note):同列数据后不同小写字母表示处理间差异显著 (P < 0.05) Values followed by different lowercase letters indicate significant difference among treatments at the 0.05 level. 微生物功能基因AOA amoA、AOB amoA、nirS和nirK数量变化趋势一致,呈现为CK < –20%CRU < CRU < –20%U < U (图4)。与U处理相比,–20%U、CRU处理分别显著降低了AOA amoA和AOB amoA基因数量19.2%、31.3%和21.5%、45.2% (P < 0.05)。与–20%U相比,–20%CRU处理显著降低了AOA amoA和AOB amoA基因数量30.0%和47.0% (P < 0.05)。与U处理相比,–20%U、CRU处理nirS和nirK基因数量分别降低了12.2%、19.4%和35.0%、48.1% (P < 0.05);与–20%U相比,–20%CRU处理nirS和nirK基因数量降低17.5%和31.3% (P < 0.05)。因此,基施控释氮肥以及减施氮肥20%可降低土壤中NH4+-N和NO3–-N含量以及功能基因AOA amoA、AOB amoA、nirS和nirK数量。
![]() 图 4 不同处理土壤硝化与反硝化基因数量[注(Note):不同小写字母表示处理间差异显著Different lowercase letters indicate significant difference among treatments at the 0.05 level.]Figure 4. The number of soil nitrification and denitrification genes under different treatments
图 4 不同处理土壤硝化与反硝化基因数量[注(Note):不同小写字母表示处理间差异显著Different lowercase letters indicate significant difference among treatments at the 0.05 level.]Figure 4. The number of soil nitrification and denitrification genes under different treatments2.4. 影响土壤N2O排放的因素
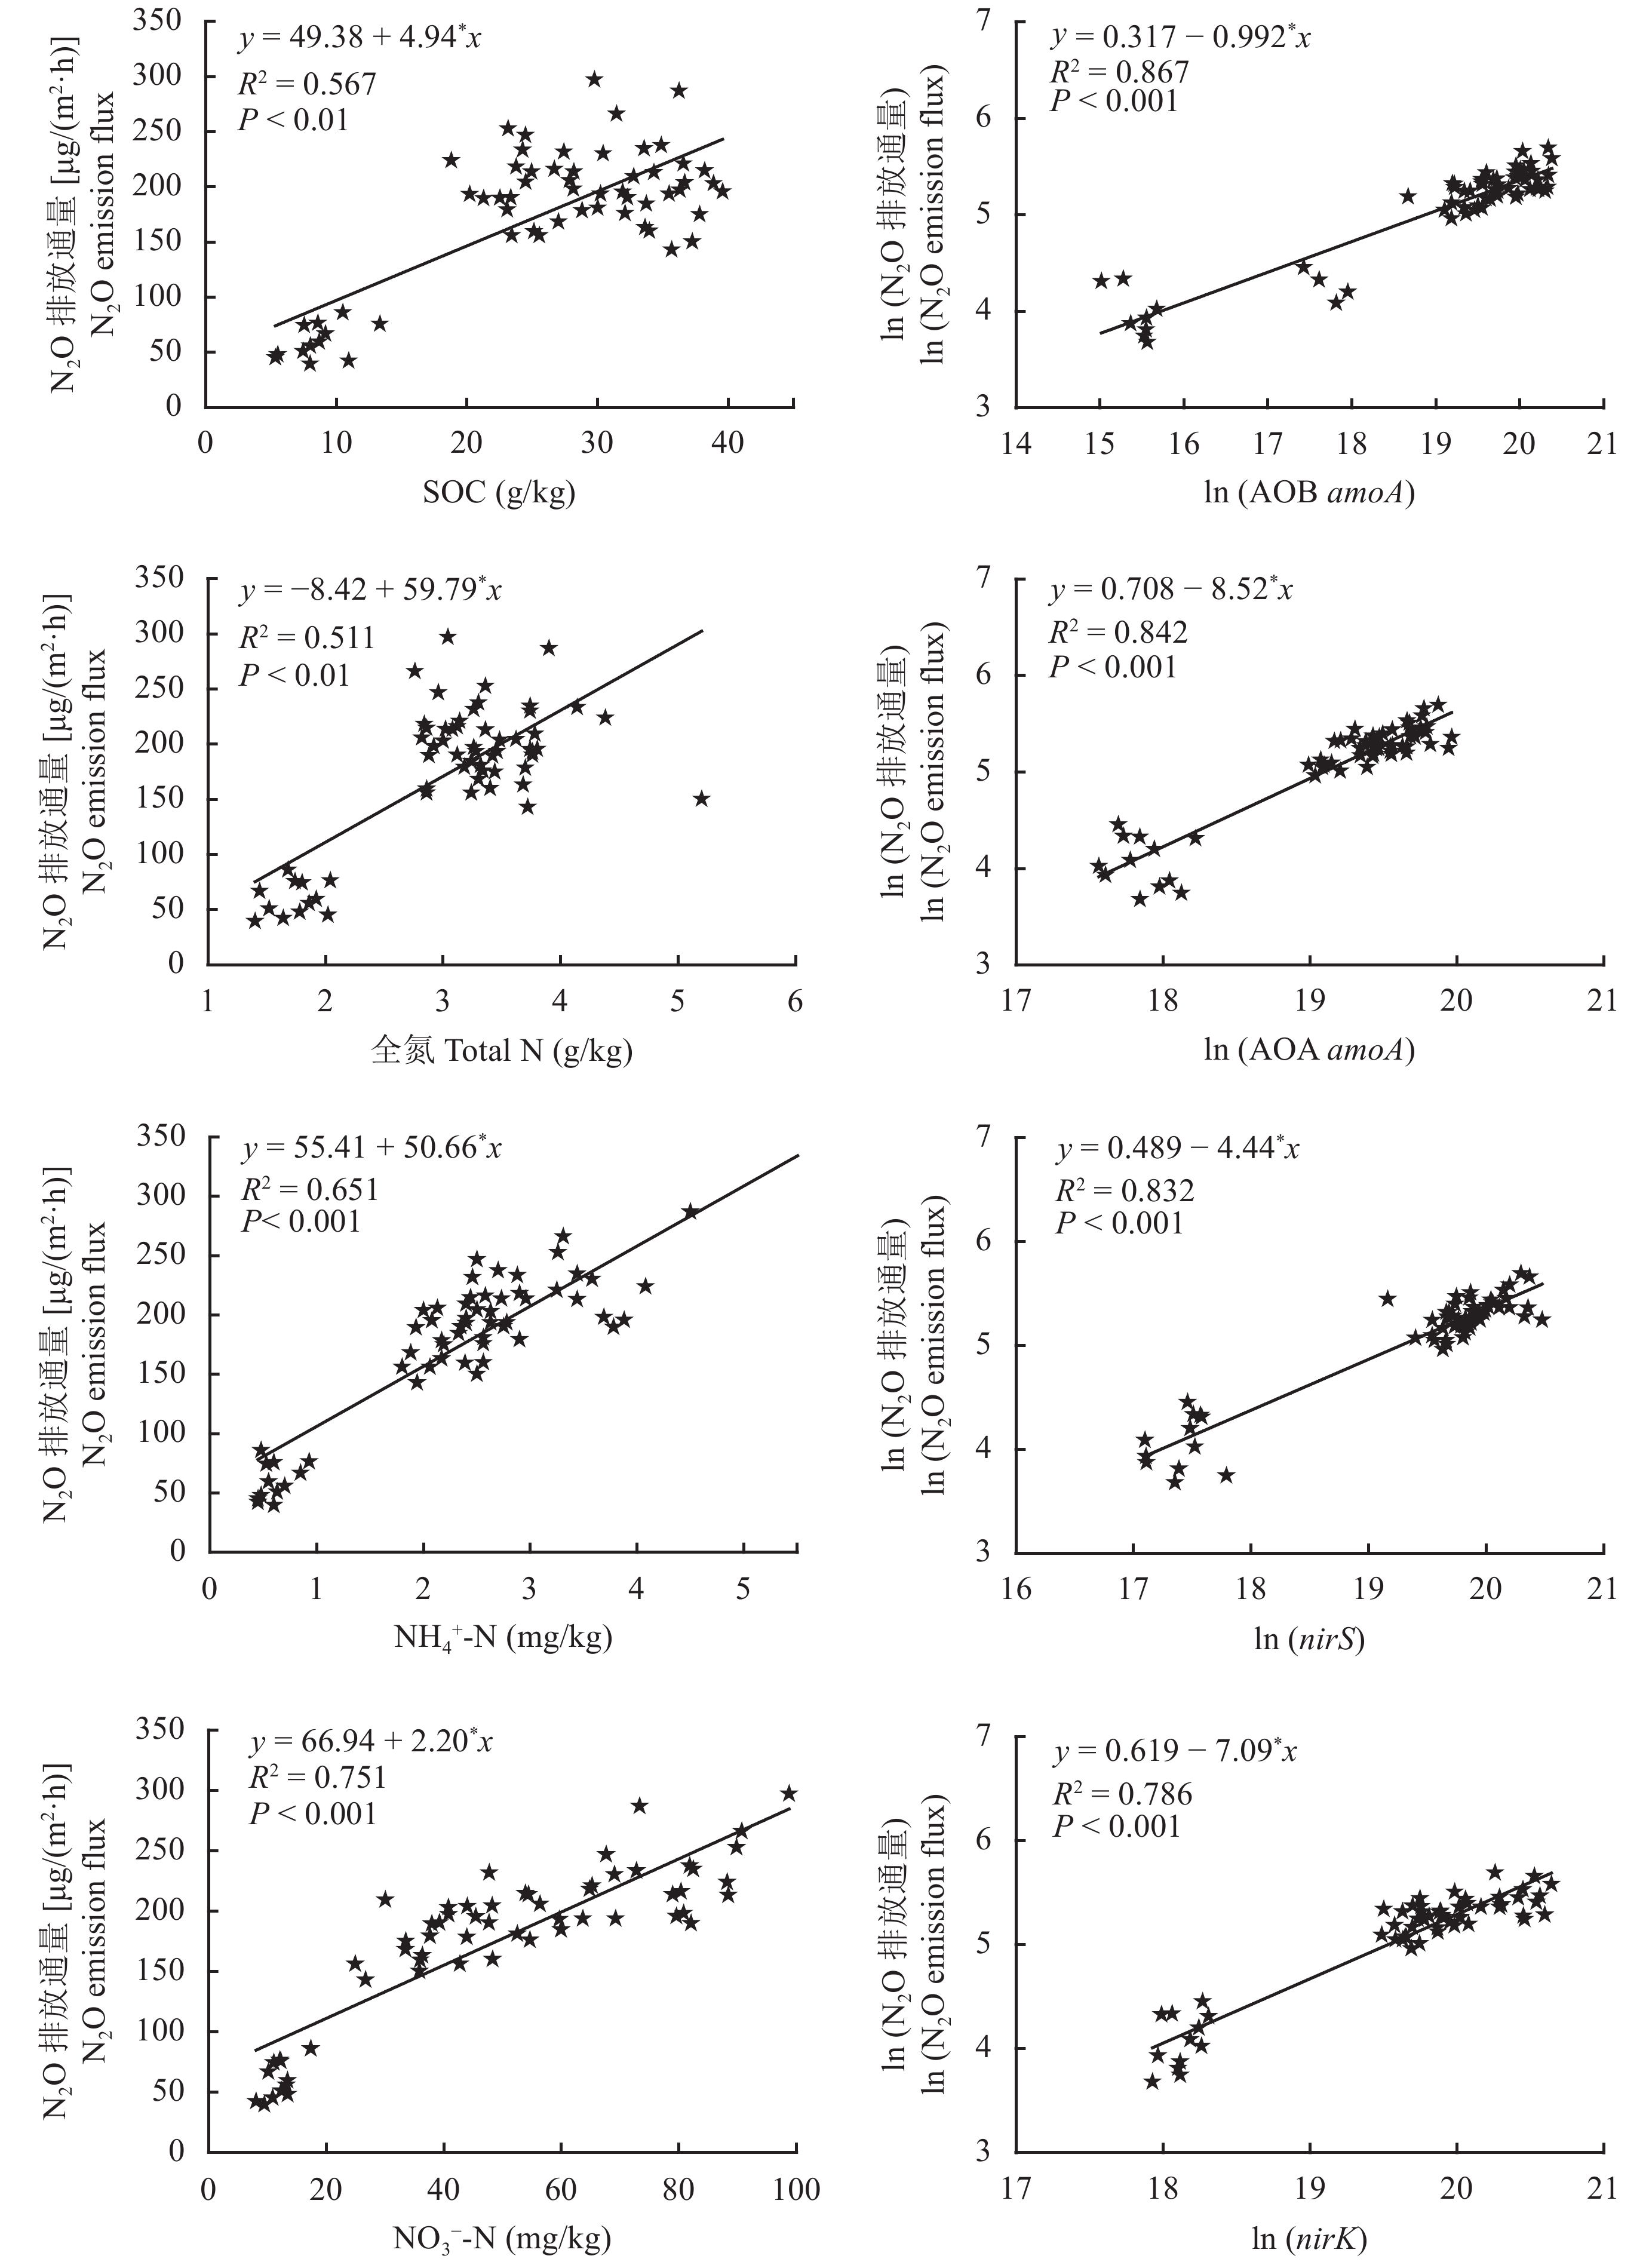
通过对环境因子与土壤N2O排放通量相关分析,得出土壤养分有机碳、全氮、NH4+-N、NO3–-N含量与土壤N2O排放通量之间关系密切 (R2值为0.511~0.751),均呈现显著正相关关系 (P < 0.01) (图5)。参与硝化与反硝化作用的关键基因AOA amoA、AOB amoA、nirS和nirK数量与土壤N2O排放通量之间关系密切 (R2值为0.786~0.867),均呈显著正相关关系 (P < 0.001) (图5)。因此,控释氮肥与水溶肥配施通过改变设施土壤有机碳、全氮、NH4+-N、NO3–-N以及参与硝化与反硝化作用的关键基因而影响土壤N2O排放。
![]() 图 5 土壤N2O排放通量与土壤理化和生物性质的关系Figure 5. Relationship between soil N2O emission flux with soil chemical and biological properties
图 5 土壤N2O排放通量与土壤理化和生物性质的关系Figure 5. Relationship between soil N2O emission flux with soil chemical and biological properties3. 讨论
3.1 控释氮肥与水溶肥配施条件下N2O排放特征及影响因素
土壤N2O的产生和释放不但受土壤氮素含量、湿度、温度、pH等土壤环境条件影响,还受参与硝化和反硝化过程的微生物群落结构和活性制约[4, 14, 23-24]。土壤中氮素含量是决定土壤N2O气体排放的关键因素[26]。农田系统中N2O的排放通量随着氮肥施入量增加而逐渐增加,其排放通量与施氮量呈显著线性正相关或者指数相关[11, 26-28],由此可见,合理的减量施氮能有效降低农田因施氮肥而引起的土壤N2O的直接排放。这与本研究的结果一致,减氮20% (–20%U处理) 降低了土壤N2O排放通量,尤其是基肥期的排放通量。这是由于氮肥施入后土壤中NH4+和NO3−浓度迅速增加,作为土壤硝化和反硝化作用的主要底物,其迅速增加必然导致硝化和反硝化过程加剧进而使其产物N2O产生量增加[29-30]。本研究的结果也证实,氮肥施加后导致土壤中NH4+和NO3−含量增加,而U处理土壤中NH4+和NO3−含量最高,导致其土壤N2O排放通量最高。因此,适宜施氮量可降低农田N2O排放通量和强度[31],合理减少化肥施氮量是设施蔬菜地N2O减排的有效途径之一[32]。在保障产量的条件下,确定合适的施氮量成为减少设施农田土壤N2O排放的关键环节和有效途径之一。
氮肥种类也是影响农田土壤N2O排放的关键因素[3]。巴闯等[33]和Zhang等[34-35]的大田研究显示施加普通尿素后,土壤N2O排放峰值迅速出现,排放量达到N 5.98~8.10 kg/hm2,主要原因是尿素施入土壤后,在脲酶作用下迅速水解成NH4+-N,NH4+-N在土壤中快速转化为NO3−-N,进而导致微生物amoA基因丰度[10]及narG、nirS、nirK基因丰度[21, 30]短时间快速增加,提升了土壤硝化与反硝化作用。本研究结果同样证实施用普通尿素的U与–20%U处理,番茄定植8~12天 (基肥期) 后和追肥后3~5天土壤N2O出现排放峰值,并且基肥期排放峰值高于追肥后的排放峰值。导致上述现象的原因归结为以下2个方面:1) 番茄定植前土壤中施入大量有机肥和化肥氮,不但增加了反应底物 (NH4+-N和NO3−-N含量),同时也为土壤微生物 (硝化AOA amoA、AOB amoA基因与反硝化nirS、nirK基因) 的生长提供了大量碳、氮等营养物质;生长初期番茄处于缓苗期,对氮素的吸收利用率低,土壤中较多氮素被微生物利用,这些因素导致基肥期高N2O排放峰值。2) 番茄生长中后期 (追肥期),灌溉致使大棚内形成高温高湿环境,极大地促进了硝化和反硝化作用发生,导致此阶段有大量的N2O排放,且排放峰值出现时间比基肥期短。
缓控释氮肥可以调控尿素溶出,降低土壤中硝化微生物 (AOA与AOB) amoA基因及反硝化微生物nirS、nirK基因数[13],减少大田和菜田氮素损失和促进作物生长[4-5, 13-33]。本研究结果同样证实等氮量条件下,控释氮肥 (CRU与–20%CRU处理) 降低了硝化微生物AOA与AOB amoA基因及反硝化微生物nirS、nirK基因数,降低了设施土壤N2O排放,这与Bruce等[15]基于大数据的Meta分析结果、Gao等[16]控制试验以及Tian等[18]对菜田土壤N2O排放通量的研究结果一致。本研究结果显示基肥期间CRU与–20%CRU处理N2O排放峰值出现在28~32天 (图1),其峰值远低于U与–20%U处理峰值,并且与追加水溶肥后N2O排放峰值相差不多。这是由于控释氮肥调控尿素溶出速率,使其缓慢释放,保持相对较低NH4+-N和NO3−-N含量及AOA amoA、AOB amoA、nirS、nirK基因数量,这些因素直接或者间接降低土壤N2O排放通量。因此,在作物种植过程中合理施用控释氮肥可有效降低农田系统土壤N2O排放通量。
3.2 控释氮肥与水溶肥配施条件下N2O累积排放量及减排效率
本研究中,设施番茄季在不改变施肥量的条件下,用控释氮肥替代尿素,N2O累积排放量从N 5.23 kg/hm2减少到N 4.19 kg/hm2,减少了24.8%,而在减氮20% 的条件下,控释氮肥替代尿素N2O累积排放量从N 4.52 kg/hm2减少到N 3.70 kg/hm2,减少了22.1%。这与朱永昶等[17]、Gao等[16]、尹兴等[36]的研究结果一致,控释氮肥具有明显的减排效果。究其原因可能是由于控释氮肥通过调控尿素溶出速率,促进作物对NH4+-N吸收,增加作物产量和肥料利用率,减少了土壤硝化与反硝化反应的底物量 (NH4+-N和NO3−-N),降低微生物活动进而降低N2O的排放量。
在等量氮肥投入的情况下,控释氮肥与水溶肥配施一定程度上增加了番茄产量和番茄种植的经济效益。本研究中,CRU处理的番茄产量和经济效益分别提升了20.2%与15.5%,–20%CRU处理的番茄产量和经济效益分别提升了15.0%与16.6%,这与曹兵等[37]的研究结论一致,说明控释氮肥与水溶肥配施模式有助于实现设施番茄高产和促进农民增收。
N2O排放强度EI常被认为是平衡温室效应和经济效益的综合指标。本研究中,等氮水平下U与–20%U处理的EI较大,经济效益较低,而CRU与–20%CRU处理的EI较小,经济效益较高,表明控释氮肥与水溶肥配施降低了设施番茄种植过程中N2O气体排放强度,获得较高的经济效益。控释氮肥与水溶肥配施,不仅能够显著降低设施N2O气体排放量及其排放强度,而且获得较高的经济效益。因此,控释氮肥与水溶肥配施在稳产增产和减少N2O温室气体方面有着明显的积极作用,在平衡设施生态系统的环境效应与经济效益上具有更好的效果。
4. 结论
1) 基施缓释肥可使N2O排放高峰出现时间从8~13天延迟到28~32天,并且显著降低了排放峰值。基施缓释肥虽然没有改变追肥后N2O排放高峰出现的时间,但降低了追肥后的N2O排放峰值。
2) 相同施氮量下,缓释肥可降低设施土壤NH4+-N和NO3−-N含量,减少与硝化和反硝化过程相关的微生物功能基因AOA amoA、AOB amoA、nirS和nirK的数量,因此,显著降低了基肥期N2O排放通量,降低了追肥期N2O排放通量。常规施氮量下,番茄生长季土壤N2O累积排放量减少了为24. 8%,减少20%氮素投入下,减少了22.1%。
3) 相同氮肥施用量条件下,控释氮肥与水溶肥配施提高了番茄产量与经济效益,降低了N2O排放强度,而减氮20%一定程度上降低了番茄产量和经济效益。
-
![]()
图 1 不同处理番茄产量
[注(Note):U—尿素Urea;CRU—控释尿素Controlled-release urea. 柱上不同小写字母表示处理间差异显著Different lowercase letters indicate significant difference among treatments at 0.05 level.]
Figure 1. Tomato yield under different treatments
![]()
图 2 不同处理N2O排放通量动态变化
[注(Note):U—尿素Urea;CRU—控释尿素Controlled-release urea.
Figure 2. Dynamics changes of N2O emission fluxes under different treatments
![]()
图 3 不同处理番茄各生长期土壤N2O排放通量与累积排放量
[注(Note):柱上不同小写字母表示处理间差异显著Different lowercase letters above the bars indicate significant difference among treatments at 0.05 level.]
Figure 3. N2O emission fluxes and N2O accumulation emissions at different growth period of tomato under different treatments
![]()
图 4 不同处理土壤硝化与反硝化基因数量
[注(Note):不同小写字母表示处理间差异显著Different lowercase letters indicate significant difference among treatments at the 0.05 level.]
Figure 4. The number of soil nitrification and denitrification genes under different treatments
![]()
图 5 土壤N2O排放通量与土壤理化和生物性质的关系
Figure 5. Relationship between soil N2O emission flux with soil chemical and biological properties
表 1 各处理具体氮肥和用量 (N kg/hm2)
Table 1 Details of nitrogen application amount in each treatment
处理
Treatment基肥 Base fertilizer 追肥 Topdressing 有机肥Manure 化肥Chemical 第1次 First time 第2次 Second time 第3次 Third time CK 0 0 0 0 0 U 120.0 128.0 76.8 38.4 76.8 –20%U 120.0 102.4 61.4 30.7 61.4 CRU 120.0 128.0 76.8 38.4 76.8 –20%CRU 120.0 102.4 61.4 30.7 61.4 注(Note):U—尿素 Urea;CRU—控释尿素 Controlled-release urea.  下载: 导出CSV
表 2 标靶基因和荧光定量PCR引物
Table 2 Target genes and primers used in fluorescent quantitative PCR
基因Gene 引物 Specific primer sequences AOA amoA Arch amoA F 5′-STAATGGTCTGGCTTAGACG-3′
Arch amoA R 5′-GCGGCCATCCATCTGTATGT-3′AOB amoA amoA-1 F 5′-GGGGTTTCTACTGGTGGT-3′
amoA-2 R 5′-CCCCTCKGSAAAGCCTTCTTC-3′nirS nirS4 F 5′-TTCRTCAAGACSCAYCCGAA-3′
nirS6 R 5′-CGTTGAACTTRCCGGT-3′nirK F1aCu 5′-ATCATGGTSCTGCCGCG-3′
R3Cu 5′-GCCTCGATCAGRTTGTGGTT-3′
下载: 导出CSV
表 3 不同处理番茄经济效益 (yuan/hm2)
Table 3 Economic benefits of tomato production under different treatments
处理
Treatment产值
Output肥料投入Fertilizer input 经济效益
Economic
benefit商品有机肥
Commercial
organic fertilizer钾肥
Potassium
fertilizer磷肥
Phosphorous
fertilizer水溶肥
Soluble
fertilizer氮肥
Nitrogen
fertilizerCK 233016 9000 0 0 0 0 233016 U 423120 9000 1670 577 4608 696 406569 –20%U 390600 9000 1756 605 3686 557 373153 CRU 488840 9000 1670 577 4608 1067 469614 –20%CRU 463040 9000 1756 605 3686 853 445297 注(Note):U—尿素 Urea;CRU—控释尿素 Controlled-release urea. 商品有机肥价格 The price of commercial organic fertilizer:600 yuan/t;尿素价格 The price of urea:2500 yuan/t;控释尿素 The price of controlled-release N fertilizer:3500 yuan/t;水溶肥价格 The price of water-soluble fertilizer:20 yuan/kg;单项磷肥 The price of phosphate fertilizer [Ca (H2PO4) 2 14%]:1000 yuan/t;单项钾肥价格 Potash fertilizer price (K2SO4,50%):3500 yuan/t;番茄价格 Tomato price:4.0 yuan/kg.
下载: 导出CSV
表 4 不同处理下土壤N2O累积排放量和排放强度
Table 4 N2O emission accumulation and emission intensity of N2O under different treatments
处理
Treatment累积排放量(N kg/hm2)
Cumulative emission排放强度(N g/t)
Emission intensityCK 1.62 ± 0.11 d 29.24 ± 1.23 b U 5.23 ± 0.39 a 49.31 ± 2.51 a –20%U 4.52 ± 0.35 ab 46.15 ± 1.83 a CRU 4.19 ± 0.37 bc 34.27 ± 1.92 b –20%CRU 3.70 ± 0.25 c 33.33 ± 1.64 b 注(Note):同列数值后不同小写字母表示处理间差异显著 (P < 0.05) Values followed by different lowercase letters indicate significant difference among treatments at 0.05 level.
下载: 导出CSV
表 5 不同处理下土壤理化性质
Table 5 Soil physical and chemical properties under different treatments
处理Treatment pH 有机碳SOC (g/kg) 全氮Total N (g/kg) NO3–-N (mg/kg) NH4+-N (mg/kg) CK 7.53 ± 0.03 a 12.59 ± 0.65 b 1.74 ± 0.06 b 11.98 ± 0.69 e 0.60 ± 0.14 d U 7.50 ± 0.02 a 28.90 ± 1.88 a 3.39 ± 0.16 a 82.58 ± 2.69 a 3.73 ± 0.28 a –20%U 7.54 ± 0.02 a 30.69 ± 1.10 a 3.17 ± 0.15 a 62.69 ± 3.48 b 2.75 ± 0.14 b CRU 7.53 ± 0.04 a 31.57 ± 1.78 a 3.48 ± 0.19 a 55.93 ± 3.58 c 2.42 ± 0.16 bc –20%CRU 7.57 ± 0.02 a 28.51 ± 1.65 a 3.19 ± 0.18 a 48.47 ± 2.11d 2.24 ± 0.13 c 注(Note):同列数据后不同小写字母表示处理间差异显著 (P < 0.05) Values followed by different lowercase letters indicate significant difference among treatments at the 0.05 level.
下载: 导出CSV
-
[1] Ravishankara A R, Daniel J S, Portmann R W. Nitrous oxide (N2O): the dominant ozone-depleting substance emitted in the 21st century[J]. Science, 2009, 326: 123-125. DOI: 10.1126/science.1176985
[2] Reay D S, Davidson E A, Smith K A, et al. Global agriculture and nitrous oxide emissions[J]. Nature Climate Change, 2012, 2(6): 410-416. DOI: 10.1038/nclimate1458
[3] Zhou Z, Shen Y, Du C, et al. Economic and soil environmental benefits of using controlled-release bulk blending urea in the North China Plain[J]. Land Degradation & Development, 2017, 28(8): 2370-2379.
[4] Hu W Y, Zhang Y X, Huang B. Soil environmental quality in greenhouse vegetable production systems in eastern China: current status and management strategies[J]. Chemosphere, 2017, 170: 183-195. DOI: 10.1016/j.chemosphere.2016.12.047
[5] Yang L, Huang B, Mao M, et al. Sustainability assessment of greenhouse vegetable farming practices from environmental, economic, and socio-institutional perspectives in China[J]. Environmental Science & Pollution Research International, 2016, 23(17): 17287-17297.
[6] Han J, Luo Y, Yang L, et al. Acidification and salinization of soils with different initial pH under greenhouse vegetable cultivation[J]. Journal of Soils & Sediments, 2014, 14(10): 1683-1692.
[7] Zhong W, Bian B, Gao N, et al. Nitrogen fertilization induced changes in ammonia oxidation are attributable mostly to bacteria rather than archaea in greenhouse-based high N input vegetable soil[J]. Soil Biology & Biochemistry, 2016, 93: 150-159.
[8] Yang L, Zhang X, Ju X. Linkage between N2O emission and functional gene abundance in an intensively managed calcareous fluvo-aquic soil[J]. Scientific Reports, 2017, 7: 43283. DOI: 10.1038/srep43283
[9] Duan P, Zhou J, Feng L, et al. Pathways and controls of N2O production in greenhouse vegetable production soils[J]. Biology and Fertility of Soils, 2019, 55(3): 285-297. DOI: 10.1007/s00374-019-01348-9
[10] Ye X H, Han B, Lia W, et al. Effects of different irrigation methods on nitrous oxide emissions and ammonia oxidizers microorganisms in greenhouse tomato fields[J]. Agricultural Water Management, 2018, 203: 115-123. DOI: 10.1016/j.agwat.2018.03.012
[11] Wang X, Zou C, Gao X, et al. Nitrate leaching from open-field and greenhouse vegetable systems in China: a meta-analysis[J]. Environmental Science & Pollution Research International, 2018, 3: 1-10.
[12] Shcherbak I, Millar N, Robertson G P. Global meta-analysis of the nonlinear response of soil nitrous oxide (N2O) emissions to fertilizer nitrogen[J]. Proceedings of the National Academy of Sciences of the United States of America, 2014, 111(25): 9199-9204. DOI: 10.1073/pnas.1322434111
[13] Akiyama H, Morimoto S, Masahito Hayatsu, et al. Nitrification, ammonia-oxidizing communities, and N2O and CH4 fluxes in an imperfectly drained agricultural field fertilized with coated urea with and without dicyandiamide[J]. Biology and Fertility of Soils, 2013, 49(2): 213-223. DOI: 10.1007/s00374-012-0713-2
[14] Guo C, Ren T, Li P, et al. Producing more grain yield of rice with less ammonia volatilization and greenhouse gases emission using slow/controlled-release urea[J]. Environmental Science and Pollution Research, 2019, 26: 2569-2579. DOI: 10.1007/s11356-018-3792-2
[15] Bruce A L, Liu L J, Chris van K, et al. Enhanced efficiency nitrogen fertilizers for rice systems: Meta-analysis of yield and nitrogen uptake[J]. Field Crops Research, 2013, 154: 246-254. DOI: 10.1016/j.fcr.2013.08.014
[16] Gao X S, Deng O P, Ling J, et al. Effects of controlled-release fertilizer on nitrous oxide and nitric oxide emissions during wheat-growing season: field and pot experiments[J]. Paddy and Water Environment, 2018, 16: 99-108. DOI: 10.1007/s10333-017-0619-6
[17] 朱永昶, 李玉娥, 秦晓波, 等. 控释肥和硝化抑制剂对华北春玉米N2O排放的影响[J]. 农业环境科学学报, 2016, 35(7): 1421-1428. DOI: 10.11654/jaes.2016.07.027 Zhu Y C, Li Y E, Qing X B, et al. Effects of controlled release fertilizer and nitrification inhibitor additions on nitrous oxide emissions from spring maize field in Northern China[J]. Journal of Agricultural Environmental Science, 2016, 35(7): 1421-1428. DOI: 10.11654/jaes.2016.07.027
[18] Tian D, Zhang Y Y, Mu Y Y, et al. The effect of drip irrigation and drip fertigation on N2O and NO emissions, water saving and grain yields in a maize field in the North China Plain[J]. Science of The Total Environment, 2017, 575: 1034-1040. DOI: 10.1016/j.scitotenv.2016.09.166
[19] 杜世宇, 薛飞, 吴汉卿, 等. 水氮耦合对设施土壤温室气体排放的影响[J]. 农业环境科学学报, 2019, 38(02): 234-242. Du S F, Xue F, Wu H Q, et al. Interactive effect of irrigation and nitrogen fertilization on greenhouse gas emissions from greenhouse soil[J]. Journal of Agricultural Environmental Science, 2019, 38(02): 234-242.
[20] Liu S W, Lin F, Wu S, et al. A meta-analysis of fertilizer induced soil NO and combined NO/N2O emissions[J]. Global Change Biology, 2016, 23(6): 2520-2532.
[21] Theodorakopoulos N, Lognoul M, Degrune F, et al. Increased expression of bacterial amoA during an N2O emission peak in an agricultural field[J]. Agriculture, Ecosystems & Environment, 2017, 236: 212-220.
[22] Lin Y, Ding W, Liu D, et al. Wheat straw-derived biochar amendment stimulated N2O emissions from rice paddy soils by regulating the amoA genes of ammonia-oxidizing bacteria[J]. Soil Biology & Biochemistry, 2017, 113: 89-98.
[23] 黄容, 高明, 王蓥燕, 等. 紫色土N2O排放及氨氧化微生物群落结构对玉米秸秆与化肥减量配施的响应[J]. 环境科学, 2019, 40(01): 403-413. Huang R, Gao M, Wang J Y, et al. Response of the soil N2O emission and ammonia-oxidizing microorganism community to the maize straw return with reducing fertilizer in purplesoil[J]. Environmental Science, 2019, 40(1): 403-413.
[24] 江雨倩, 李虎, 王艳丽, 等. 滴灌施肥对设施菜地N2O排放的影响及减排贡献[J]. 农业环境科学学报, 2016, 35(8): 1616-1624. DOI: 10.11654/jaes.2016-0109 Jiang Y Q, LI H, Wang Y L, et al. Effects of fertigation on N2O emissions and their mitigation in greenhouse vegetable fields[J]. Journal of Agro-Environment Science, 2016, 35(8): 1616-1624. DOI: 10.11654/jaes.2016-0109
[25] Morley N, Baggs E M, Peter Dörsch, et al. Production of NO, N2O and N2 by extracted soil bacteria, regulation by NO2− and O2 concentrations[J]. Fems Microbiology Ecology, 2010, 65(1): 102-112.
[26] 王玉英, 李晓欣, 董文旭, 等. 华北平原农田温室气体排放与减排综述[J]. 中国生态农业学报, 2018, (2): 167-174. Wang Y Y, Li X X, Dong W X, et al. Review on greenhouse gas emission and reduction in wheat-maize double cropping system in the North China Plain[J]. Chinese Journal of Eco-Agriculture, 2018, (2): 167-174.
[27] Diao T T, Xie L Y, Guo L P, et al. Measurements of N2O emissions from different vegetable fields on the North China Plain[J]. Atmospheric Environment, 2013, 72: 70-76. DOI: 10.1016/j.atmosenv.2013.02.040
[28] Zhang M, Chen Z Z, Li Q L, et al. Quantitative relationship between nitrous oxide emissions and nitrogen application rate for a typical intensive vegetable cropping system in Southeastern China[J]. CLEAN - Soil, Air, Water, 2016, 44(12): 1725-1732. DOI: 10.1002/clen.201400266
[29] 陈吉吉. 设施菜田土壤N2O产生的相关过程及功能基因表达[D]. 北京: 中国农业大学博士学位论文, 2018. Chen J J. Relevant processes and functional gene expression of N2O production in protected vegetable soils[D]. Beijing: PhD Dissertation of China Agricultural University, 2018.
[30] Zhang L, Zeng G, Zhang J, et al. Response of denitrifying genes coding for nitrite (nirK or nirS) and nitrous oxide (nosZ) reductases to different physicochemical parameters during agricultural waste composting[J]. Applied Microbiology and Biotechnology, 2015, 99(9): 4059-4070. DOI: 10.1007/s00253-014-6293-3
[31] 山楠, 赵同科, 毕晓庆, 等. 适宜施氮量降低京郊小麦-玉米农田N2O排放系数增加产量[J]. 农业工程学报, 2016, 32(22): 163-169. DOI: 10.11975/j.issn.1002-6819.2016.22.022 Shan N, Zhao T K, Bi X Q, et al. Suitable nitrogen application reducing N2O emission and improving grain yield in wheat-maize crop rotation system in Beijing suburb[J]. Journal of Agricultural Engineering, 2016, 32(22): 163-169. DOI: 10.11975/j.issn.1002-6819.2016.22.022
[32] 徐钰, 刘兆辉, 魏建林, 等. 北方典型设施菜地土壤N2O排放特征[J]. 山东农业科学, 2016, (10): 86-94. Xu Y, Liu Z H, Wei J L, et al. Emission characteristics of soil nitrous oxide from typical greenhouse vegetable fields in North China[J]. Shandong Agricultural Sciences, 2016, (10): 86-94.
[33] 巴闯, 杨明, 邹洪涛, 等. 包膜/抑制剂联合调控对农田土壤N2O排放和氨挥发的影响[J]. 农业环境科学学报, 2018, 37(6): 1291-1299. DOI: 10.11654/jaes.2017-1538 Ba C, Yang M, Zou H T, et al. Combined effects of coating/inhibitors on N2O emission and ammonia volatilization in farmland soil[J]. Journal of Agricultural Environmental Sciences, 2018, 37(6): 1291-1299. DOI: 10.11654/jaes.2017-1538
[34] Zhang M, Wang W, Bai S H, et al. Antagonistic effects of nitrification inhibitor 3,4-dimethylpyrazole phosphate and fungicide iprodioneon net nitrification in an agricultural soil[J]. Soil Biology and Biochemistry, 2018, 116: 167-170. DOI: 10.1016/j.soilbio.2017.10.014
[35] Zhang Z, Zhang W, Yang H, et al. Elevated N2O emission by the rice roots: based on the abundances of narG and bacterialamoA genes[J]. Environmental Science & Pollution Research, 2017, 24(2): 1-10.
[36] 尹兴, 张丽娟, 李博文, 等. 氮肥与双氰胺配施对温室番茄生产及活性氮排放的影响[J]. 中国农业科学, 2018, 51(9): 1725-1734. DOI: 10.3864/j.issn.0578-1752.2018.09.010 Yin X, Zhang L J, Li B W, et al. Effects of nitrogen fertilizer and dicyandiamide application on tomato growth and reactive nitrogen emissions in greenhouse[J]. Agricultural Science of China, 2018, 51(9): 1725-1734. DOI: 10.3864/j.issn.0578-1752.2018.09.010
[37] 曹兵, 倪小会, 肖强, 等. 包膜尿素对温室番茄产量、品质和经济效益的影响[J]. 植物营养与肥料学报, 2014, (2): 389-395. DOI: 10.11674/zwyf.2014.0215 Cao B, Ni X H, Xiao Q, et al. Impact of coated Urea on yield, quality and economic returns of greenhouse tomato[J]. Journal of Plant Nutrition and Fertilizers, 2014, 20(2): 389-395. DOI: 10.11674/zwyf.2014.0215


计量
- 文章访问数: 3891
- HTML全文浏览量: 1254
- PDF下载量: 134
