
Effects of partial substitution of chemical fertilizer with manure and/or straw on soil nematode community in greenhouse vegetable production
-
摘要:目的
利用天津市西青区基地日光温室蔬菜不同施肥模式定位试验,研究有机肥/秸秆替代化肥模式对设施蔬菜土壤线虫总数、群落结构和生态指数的影响,为构建健康的土壤动物区系提供科学依据。
方法定位试验共设6个处理,分别为:1) 全部施用化肥氮 (4/4CN);2) 3/4化肥氮 + 1/4猪粪氮 (3/4CN + 1/4MN);3) 2/4化肥氮 + 2/4猪粪氮 (2/4CN + 2/4MN);4) 1/4化肥氮 + 3/4猪粪氮 (1/4CN + 3/4MN);5) 2/4化肥氮 + 1/4猪粪氮 + 1/4秸秆氮 (2/4CN + 1/4MN + 1/4SN);6) 2/4化肥氮 + 2/4秸秆氮 (2/4CN + 2/4SN),各处理为等氮磷钾设计。第16茬 (土壤消毒后) 和第18茬 (土壤消毒1年后) 蔬菜 (春茬番茄) 拉秧后,分别采集0—5、5—10和10—20 cm土层土壤样品,测定土壤线虫相关指标。
结果1) 有机肥/秸秆替代化肥模式0—5、5—10和10—20 cm土层土壤线虫总数均高于单施化肥模式,平均分别增加16.8%、31.8%和11.2%;配施高量有机肥模式 (1/4CN + 3/4MN) 和配施秸秆模式 (2/4CN + 1/4MN + 1/4SN、2/4CN + 2/4SN) 各土层线虫总数相对较高,较单施化肥模式分别提高12.1%~26.4%、34.3%~42.8%、13.2%~18.3%。2) 与单施化肥模式相比,有机肥/秸秆替代化肥模式,尤其是配施高量有机肥模式和配施秸秆模式可提高0—5和5—10 cm土层土壤有益线虫 (食细菌、食真菌和捕食/杂食性线虫) 营养类群个体数量,其中0—5 cm土层上述线虫营养类群个体数量平均分别增加13.0%、7.4%和26.7%,5—10 cm土层平均分别增加35.5%、20.2%和56.5%。有机肥/秸秆替代化肥模式0—5和5—10 cm土层土壤有害植食性线虫数量虽均高于单施化肥模式,但其相对丰度均低于单施化肥模式,平均分别降低6.3%和13.1%。3) 有机肥/秸秆替代化肥模式,尤其是配施高量有机肥模式和配施秸秆模式,MI值、WI值、EI值和SI值均高于单施化肥模式,0—5 cm土层平均分别增加3.9%、11.5%、6.2%和130.4%,5—10 cm土层平均分别增加1.8%、19.1%、2.4%和138.7%。
结论在N、P2O5和K2O投入量不变的情况下,有机肥/秸秆替代化肥模式可促进土壤有益线虫 (食细菌线虫、食真菌线虫和捕食/杂食性线虫) 生长繁殖,还可降低土壤有害植食性线虫相对丰度,对土壤有害植食性线虫起到一定的抑制作用。综合来看,有机肥/秸秆替代化肥模式,尤其是配施高量有机肥模式和配施秸秆模式,可优化土壤线虫群落结构,降低土壤环境的受干扰程度,改善土壤的质量,使设施蔬菜土壤生态系统向稳定健康的方向发展。结合本试验9年产量数据 (2/4CN + 1/4MN + 1/4SN模式产量最高)、土壤线虫群落相关研究结果以及实际可操作性,化肥与有机肥、秸秆配施模式(2/4CN + 1/4MN + 1/4SN)可实现设施蔬菜持续高产。
-
关键词:
- 设施菜田 /
- 有机肥/秸秆替代化肥模式 /
- 土壤线虫 /
- 群落结构 /
- 生态指数
Abstract:ObjectivesA fixed-site greenhouse vegetable field fertilization experiment was carried out in Xiqing District, Tianjin to investigate the effects of partial substitution of chemical fertilizer with manure and/or straw on the total number of soil nematode, nematode community structure and nematode ecological indices for providing a scientific basis for the construction of healthy soil fauna.
MethodsSix treatments were included based on substitution of chemical fertilizer nitrogen (N) with different exogenous organic resources: 1) complete chemical N (4/4CN); 2) 3/4 chemical N plus 1/4 manure N (3/4CN + 1/4MN); 3) 2/4 chemical N plus 2/4 manure N(2/4CN + 2/4MN); 4) 1/4 chemical N plus 3/4 manure N (1/4CN + 3/4MN); 5) 2/4 chemical N plus 1/4 manure N plus 1/4 straw N (2/4CN + 1/4MN + 1/4SN), and 6) 2/4 chemical N plus 2/4 straw N (2/4CN + 2/4SN). All treatments had the same amounts of N, P2O5, and K2O inputs. After the uprooting stage of the 16th-season vegetable (after soil disinfection) and the 18th-season vegetable (one year after soil disinfection), surface soil (0‒5, 5‒10, and 10‒20 cm depth) samples were collected for the determination of the nematode-associated indices.
Results1) The total number of nematode were increased in organic-amended soils by 16.8%, 31.8%, and 11.2%, respectively, compared with those in 4/4CN-treated soils in the 0‒5, 5‒10, and 10‒20 cm soil layers. Moreover, the total number of nematode in the 1/4CN + 3/4MN, 2/4CN + 1/4MN + 1/4SN, and 2/4CN + 2/4SN treatments were relatively higher than other organic-amended treatments, which were increased by 12.1%‒26.4%, 34.3%‒42.8%, and 13.2%‒18.3%, respectively, compared with those in the 4/4CN treatment in different layers. 2) The number of beneficial nematodes, i.e., bacterivore, fungivore, and omnivore-predator, were higher in organic-amended soils than those in 4/4CN-treated soil by respective average of 13.0%, 7.4%, and 26.7% in the 0‒5 cm soil layer, and 35.5%, 20.2%, and 56.5% in the 5‒10 cm soil layer. In comparison with the 4/4CN treatment, organic amendments increased the number of harmful herbivore, but decreased the relative abundances of harmful herbivore by average of 6.3% and 13.1%, respectively, in the 0‒5 cm and 5‒10 cm layers. 3) The organic amendments, especially the 1/4CN + 3/4MN, 2/4CN + 1/4MN + 1/4SN and 2/4CN + 2/4SN treatments had higher MI, WI, EI and SI values than the 4/4CN treatment, which were increased by 3.9%, 11.5%, 6.2%, and 130.4%, respectively, in the 0‒5 cm soil layer, and by 1.8%, 19.1%, 2.4%, and 138.7%, respectively, in the 5‒10 cm soil layer.
ConclusionsUnder the same N, P2O5, and K2O rates, organic amendments could promote the growth of nematodes and relative abundances of beneficial nematodes (i.e., bacterivore, fungivore, and omnivore-predator). Conversely, organic amendments could decrease the relative abundances of harmful herbivores, and thus inhibite harmful herbivores growth. Overall, organic amendments could optimize soil nematode community structure, decrease soil environmental interference, and improve soil quality conditions, which is beneficial for soil ecosystems healthy development in the greenhouse vegetable production. Combined with the 9-year yield of this experiment (the yield is highest in the 2/4CN + 1/4MN + 1/4SN treatment), soil nematode data and practical operability, chemical fertilizer plus organic manure plus corn straw (2/4CN + 1/4MN + 1/4SN) is a continuous high-yield fertilization treatment for greenhouse vegetables.
-
目前我国蔬菜播种面积达0.2亿hm2 (3亿余亩),占全国种植业的1/7左右,产值约占30%,其中设施蔬菜播种面积已达到386.7万hm2 (5800万亩),约占蔬菜总播种面积的1/5,产值占蔬菜总产值的50%以上,设施蔬菜已成为许多地区的农业支柱产业[1-2]。化肥是蔬菜高产的保障[3]。然而,在设施蔬菜生产中,普遍存在着化肥施用过量、氮磷钾比例失衡等现象,导致土壤养分非均衡化、次生盐渍化、生物多样性下降等一系列较为严重的问题,制约我国设施蔬菜产业的发展[1, 4-5]。针对上述问题,越来越多的学者指出有机与无机肥料配合施用作为合理的施肥措施,对于改善设施蔬菜土壤质量和维持可持续发展具有重要意义[6-7]。猪粪在设施菜田上应用较为广泛,但其碳氮比较低,较易降解,且含有重金属,过量施用会导致土壤肥力退化、重金属污染等问题[8],而作物秸秆作为我国重要的生物质资源,有机质含量丰富且碳氮比较高[9],与化肥或有机肥优化配施,能协调好土壤养分与能量 (C/N) 间的平衡,最终改善土壤质量并维持设施菜田土壤高效生产和持续利用[10]。
土壤动物是土壤生态系统的重要组成部分,是土壤物质循环、能量流动和结构改善的主要调节者[11-14]。土壤线虫作为土壤中种类最为丰富的动物群落,在维持农业生态系统稳定、改善土壤生态功能等方面发挥着重要作用[15-21]。土壤线虫具有分布广泛、营养类群多样、生活周期短、对各类自然及人为措施响应迅速等特点,其物种多样性指数、群落结构指数、功能性指数等可作为监测农业管理措施干扰和评价土壤健康状况的关键指标[17, 22-23]。近年来,对农业生态系统中土壤自由生活线虫群落的研究还没有引起学者的广泛关注,前人的研究重点集中于对农业产生经济影响的土壤有害植食性线虫方面[24-25]。关于不同施肥模式对土壤线虫群落影响的研究也多集中于玉米[26-27]、水稻[28-29]、小麦[30-31]等粮食作物,而关于有机肥/秸秆替代化肥模式对设施蔬菜土壤整个线虫群落的影响关注较少。因此,本研究基于天津市西青区基地已开展9年的日光温室蔬菜不同施肥模式定位试验,在调查不同施肥模式下土壤线虫群落组成的基础上,分析不同有机肥源 (秸秆、有机肥) 及其与化肥配施的不同比例对设施菜田土壤线虫群落的调控效果;并以土壤线虫群落特征作为生物指示因子,分析有机肥/秸秆替代化肥对设施菜田土壤健康和质量状况的影响,为设施菜田制定高效合理的施肥模式提供一定的科学依据。
1. 材料与方法
1.1 试验地概况
本定位试验地点位于天津市西青区辛口镇第六埠村,试验区域属于暖温带半湿润大陆性气候,全年平均温度为11.6℃,全年日照总量为2810.4 h,无霜期203天,自然降雨量为586 mm。供试日光温室东西走向,长80 m、宽6.5 m (含0.5 m通道),前部有通风口,白天适时敞开通风,夜间或降雨时关闭。定位试验开始时间为2009年10月 (定位试验开始时棚龄为7年),种植制度为春茬番茄–秋冬茬芹菜轮作。供试土壤为中壤质潮土。定位试验开始前0—20 cm土层的土壤理化性状:pH 7.9、有机质25.4 g/kg、硝态氮186 mg/kg、有效磷145 mg/kg、速效钾404 mg/kg。供试芹菜 (Apium graveolens) 品种为‘文图拉’,番茄 (Lycopersicon esculentum) 品种为‘朝研299’。
1.2 试验设计
定位试验共设6个处理,分别为:1) 全部施用化肥氮 (4/4CN);2) 3/4化肥氮 + 1/4猪粪氮 (3/4CN + 1/4MN);3) 2/4化肥氮 + 2/4猪粪氮 (2/4CN + 2/4MN);4) 1/4化肥氮 + 3/4猪粪氮 (1/4CN + 3/4MN);5) 2/4化肥氮 + 1/4猪粪氮 + 1/4秸秆氮 (2/4CN + 1/4MN + 1/4SN);6) 2/4化肥氮 + 2/4秸秆氮 (2/4CN + 2/4SN)。试验为随机区组设计,每个处理3次重复,小区面积为14.4 m2 (宽2.4 m × 长6.0 m),小区间埋设厚度4 mm的PVC板 (埋入地下100 cm、地上露5 cm),防止小区间养分和水分的横向移动。各处理氮、磷、钾用量相同,番茄茬施用的N、P2O5和K2O总量分别为450.0、225.0和600.0 kg/hm2,芹菜茬N、P2O5和K2O总量分别为450.0、300.0和600.0 kg/hm2。春茬番茄和秋冬茬芹菜各处理的具体氮和碳的施用量见表1。番茄株行距为0.3 m × 0.6 m,种植密度为25000株/hm2;芹菜株行距为0.20 m × 0.15 m,种植密度为330570株/hm2。
表 1 试验处理及其氮和碳施用量 (kg/hm2)Table 1. Treatments and the corresponding N and C inputs from different sources处理
Treatment氮投入量N input 碳投入量C input 化肥
Chemical fertilizer有机肥
Organic manure秸秆
Corn straw合计氮
Total N有机肥
Organic manure秸秆
Corn straw合计碳
Total C春茬番茄季Spring tomato growing season 4/4CN 450.0 0 0 450.0 0 0 0 3/4CN + 1/4MN 337.5 112.5 0 450.0 1130 0 1130 2/4CN + 2/4MN 225.0 225.0 0 450.0 2260 0 2260 1/4CN + 3/4MN 112.5 337.5 0 450.0 3391 0 3391 2/4CN + 1/4MN + 1/4SN 225.0 112.5 112.5 450.0 1130 4618 5748 2/4CN + 2/4SN 225.0 0 225.0 450.0 0 9236 9236 秋冬茬芹菜季Autumn-winter celery growing season 4/4CN 450.0 0 0 450.0 0 0 0 3/4CN + 1/4MN 337.5 112.5 0 450.0 1130 0 1130 2/4CN + 2/4MN 225.0 225.0 0 450.0 2260 0 2260 1/4CN + 3/4MN 112.5 337.5 0 450.0 3391 0 3391 2/4CN + 1/4MN + 1/4SN 225.0 112.5 112.5 450.0 1130 4618 5748 2/4CN + 2/4SN 225.0 0 225.0 450.0 0 9236 9236 有机肥全部基施,化肥除部分基施外,其余部分作追肥施用。番茄季1)~6)处理所用化肥中20%的氮肥、70%的磷肥和20%的钾肥基施,其余的氮肥和钾肥分4次追施,分别在番茄开花期、第一穗果膨大期、第二穗果膨大期和第三穗果膨大期,其中氮肥的追施比例分别为30%、30%、10%和10%,钾肥的追施比例分别为10%、30%、30%和10%,剩余的磷肥分别在第一次追肥和第二次追肥时各施入15%。芹菜季1)~6)处理所用化肥中20%的氮肥、70%的磷肥和20%的钾肥基施,其余氮肥和钾肥在芹菜5~6叶期、8~9叶期和11~12叶期分3次追施,其中氮肥的追施比例分别为35%、35%和10%,钾肥的追施比例分别为10%、35%和35%,剩余的磷肥在第一次追肥时全部施入。
定位试验所用化肥为尿素 (N 46%)、过磷酸钙 (P2O5 12%)、磷酸二铵 (N 18%、P2O5 46%)、氯化钾 (K2O 60%) 和磷酸二氢钾 (P2O5 52%、K2O 34%)。所用商品猪粪N、P2O5、K2O和C (干基) 含量分别为21.7、13.9、16.3和218.0 g/kg,水分含量为28.9%。所用秸秆N、P2O5、K2O和C (干基) 含量分别为10.4、3.2、16.9和426.9 g/kg,水分含量为64.9%。
基施方式为肥料撒施后旋耕入土,追施方式为肥料溶于水后随水冲施。依据田间持水量进行灌溉,当田间持水量低于60%时进行灌溉。为保证灌水量的准确,每个小区均安装有单独的PVC进水管,并用水表记录灌水量。番茄季和芹菜季灌水总量分别为3889和3334 m3/hm2。
根据农民习惯管理方式,每一年或两年对设施菜田进行一次土壤消毒。本试验土壤消毒方法为威百亩加高温闷棚,具体方法如下:2017年7月番茄拉秧后,将试验小区地表覆膜 (厚度0.08 mm),威百亩稀释液通过沟灌施入小区,闷棚40天后揭膜、排气。试验中使用的威百亩为利民化工股份有限公司生产,有效成分 (威百亩) 总含量35%,施用量为600 kg/hm2,稀释倍数为100倍。
1.3 土壤样品采集及测定方法
2017年8月24日土壤消毒结束后采集土壤样品;2018年6月10日在定位试验第18茬蔬菜 (春茬番茄) 拉秧后 (土壤消毒1年后) 采集土壤样品。取样方法是在每个小区内按"S"形布设10个点,用100 cm3环刀采集0—5、5—10和10—20 cm土层土壤样品,分别合并为3个混合土壤样品。鲜土样品置于冰盒中并迅速运至实验室,剔除石砾和植物残根等杂物,混合均匀,过2 mm筛,土壤样品于4℃冰箱内保存,用于测定土壤线虫指标。
1.4 土壤线虫分离鉴定及线虫生态指数的计算
采用改良贝尔曼漏斗法分离土壤线虫,称取20 g土壤样品,用纱布包好后置于漏斗中铁丝网上,漏斗上端设置有60瓦的白炽灯,下端装有带止水夹的乳胶管,漏斗中加入蒸馏水浸没土壤,20℃室温条件下分离,期间不断加入蒸馏水,经过24 h后,将液体收集到离心管中,65℃水浴加热30 min,加入等体积三乙醇胺福尔马林液 (固定液),保存待用[32-33]。
将分离好的土壤线虫置于培养皿中,参考《中国土壤动物检索图鉴》和《植物线虫分类学》对所观察的土壤线虫进行计数和鉴定,依据土壤线虫的形态学特征用体式显微镜将所有分离出的线虫鉴定到属,将土壤线虫分为以下类群:食细菌线虫、食真菌线虫、植食性线虫和捕食/杂食性线虫。其中,食细菌线虫、食真菌线虫和捕食/杂食性线虫合称自由生活线虫,在土壤有机质分解和养分循环中发挥着重要作用,可被看作为“有益线虫”;而植食性线虫以作物根系为食,不利于根系健康生长,造成作物根系畸形,易引起其他病原物的复合侵染[34],可视为“有害线虫”。
采用多种生态指数对土壤线虫的物种多样性、群落结构和功能多样性进行评价,具体计算方法如下:
1) 香农多样性指数H′ = –ΣPi×lnPi[35]
2) Simpson优势度指数λ = 1-Σ (Pi) 2[19]
3) 自由生活线虫成熟度指数 MI = Σvi × fi[36]
4) 植食性线虫成熟度指数PPI = Σvi × fi′[36]
5) 瓦斯乐斯卡指数WI = (FF + BF)/PP[37]
6) 富集指数EI = 100 × [e/(e + b)][38]
7) 通道指数CI = 100 × [0.8 × FF2/(3.2 × BF1 + 0.8 × FF2)][36]
8) 结构指数SI = 100 × [s/(s + b)][39]
式中:Pi = ni/N,ni为每个营养类群的个体数,N为总的个体数;vi为土壤线虫第i类群的c–p值,fi为自由生活线虫的第 i 类群 (食细菌线虫、食真菌线虫和捕食/杂食性线虫) 个体占群落总个体数的比例;fi′为植食性线虫第i类群的个体占群落总个体数的比例;BF、FF、PP、OP分别表示食细菌、食真菌、植食性和捕食/杂食性线虫的数量,s = BFn × Wn + FFn × Wn + OPn × Wn,b = 0.8 × (BF2 + FF2),e = 3.2 × BF1 + 0.8 × FF2,n = 3~5,W3 = 1.8,W4 = 3.2,W5 = 5.0,BFn表示c–p值为n的食细菌线虫数量,FFn表示c–p为n的食真菌线虫数量,OPn表示c–p值为n的捕食/杂食性线虫数量。
1.5 数据分析
采用Microsoft Excel 2016和SPSS 16.0 (SPSS Inc. Chicago,IL) 统计软件进行数据分析,运用单因素方差分析 (one-way analysis of variance) 对不同施肥模式间平均值进行比较,平均值 ± 标准差表示样本的分散程度,采用F检验评价6个施肥模式间的各项指标差异,P < 0.05为差异显著。
2. 结果与分析
2.1 有机肥/秸秆替代化肥模式对设施菜田土壤线虫总数的影响
由表2可知,土壤消毒后 (第16茬蔬菜拉秧后) 各施肥处理土壤线虫总数均很少(每100 g干土28~49条),且不同施肥模式土壤线虫总数在同一土层水平上差异不显著。土壤消毒1年后 (第18茬蔬菜拉秧后),0—5、5—10和10—20 cm土层土壤线虫总数分别在每100 g干土1930~2439、932~1330和635~751条,较土壤消毒后相应土层分别增加53、34和19倍;土壤消毒1年后0—5 cm土层土壤线虫总数平均分别是5—10和10—20 cm土层的2和3倍。
表 2 不同施肥模式下土壤消毒后不同时间各土层线虫总数[No./100 g, dry soil)]Table 2. The total number of nematode in each soil layer under different fertilization patterns at differenttime after soil disinfection处理
Treatment0—5 cm 5—10 cm 10—20 cm ASD ASD1 ASD ASD1 ASD ASD1 4/4CN 36 ± 1 a 1930 ± 20 Ac 32 ± 10 a 932 ± 105 Bb 34 ± 9 a 635 ± 38 Ca 3/4CN + 1/4MN 39 ± 8 a 2134 ± 43 Abc 28 ± 9 a 1050 ± 158 Bab 32 ± 4 a 670 ± 75 Ca 2/4CN + 2/4MN 49 ± 7 a 2300 ± 192 Aab 41 ± 4 a 1223 ± 164 Ba 42 ± 3 a 673 ± 75 Ca 1/4CN + 3/4MN 41 ± 3 a 2439 ± 242 Aa 35 ± 4 a 1284 ± 126 Ba 31 ± 6 a 751 ± 28 Ca 2/4CN + 1/4MN + 1/4SN 43 ± 11 a 2163 ± 86 Aabc 37 ± 10 a 1330 ± 221 Ba 41 ± 8 a 719 ± 112 Ca 2/4CN + 2/4SN 37 ± 6 a 2235 ± 166 Aab 30 ± 3 a 1252 ± 111 Ba 31 ± 1 a 719 ± 87 Ca 注(Note):ASD—土壤消毒后 After soil disinfection; ASD1—土壤消毒 1 年后 1 year after soil disinfection ; 同列数据后不同小写字母表示处理间差异显著 (P < 0.05) Values followed by different lowercase letters in the same column indicate significant difference among the fertilization treatments (P < 0.05); 同行数据后不同大写字母表示同一时期同一处理不同土层间差异显著 (P < 0.05) Values followed by different capital letters in the same row indicate significant difference among soil layers in the same period (P < 0.05). 土壤消毒1年后,有机肥/秸秆替代化肥模式0—5、5—10和10—20 cm土层土壤线虫总数均高于单施化肥模式,其中配施高量有机肥模式 (1/4CN + 3/4MN) 和配施秸秆模式 (2/4CN + 1/4MN + 1/4SN、2/4CN + 2/4SN) 土壤线虫总数相对较高 (表2)。有机肥/秸秆替代化肥模式0—5、5—10和10—20 cm土层土壤线虫总数分别在每100 g干土2134~2439、1050~1330和670~751条,较单施化肥模式 (4/4CN) 对应土层平均分别增加16.8%、31.8%和11.2%,其中配施高量有机肥模式和配施秸秆模式增幅较大 (0—5、5—10和10—20 cm土层增幅分别为12.1%~26.4%、34.3%~42.8%、13.2%~18.3%)。
2.2 不同有机肥/秸秆替代化肥模式对设施菜田土壤线虫营养类群的影响
由于土壤消毒后线虫数量过少,对土壤线虫营养类群无法划分,所以仅统计土壤消毒1年后不同施肥模式下0—5和5—10 cm土层线虫营养类群。
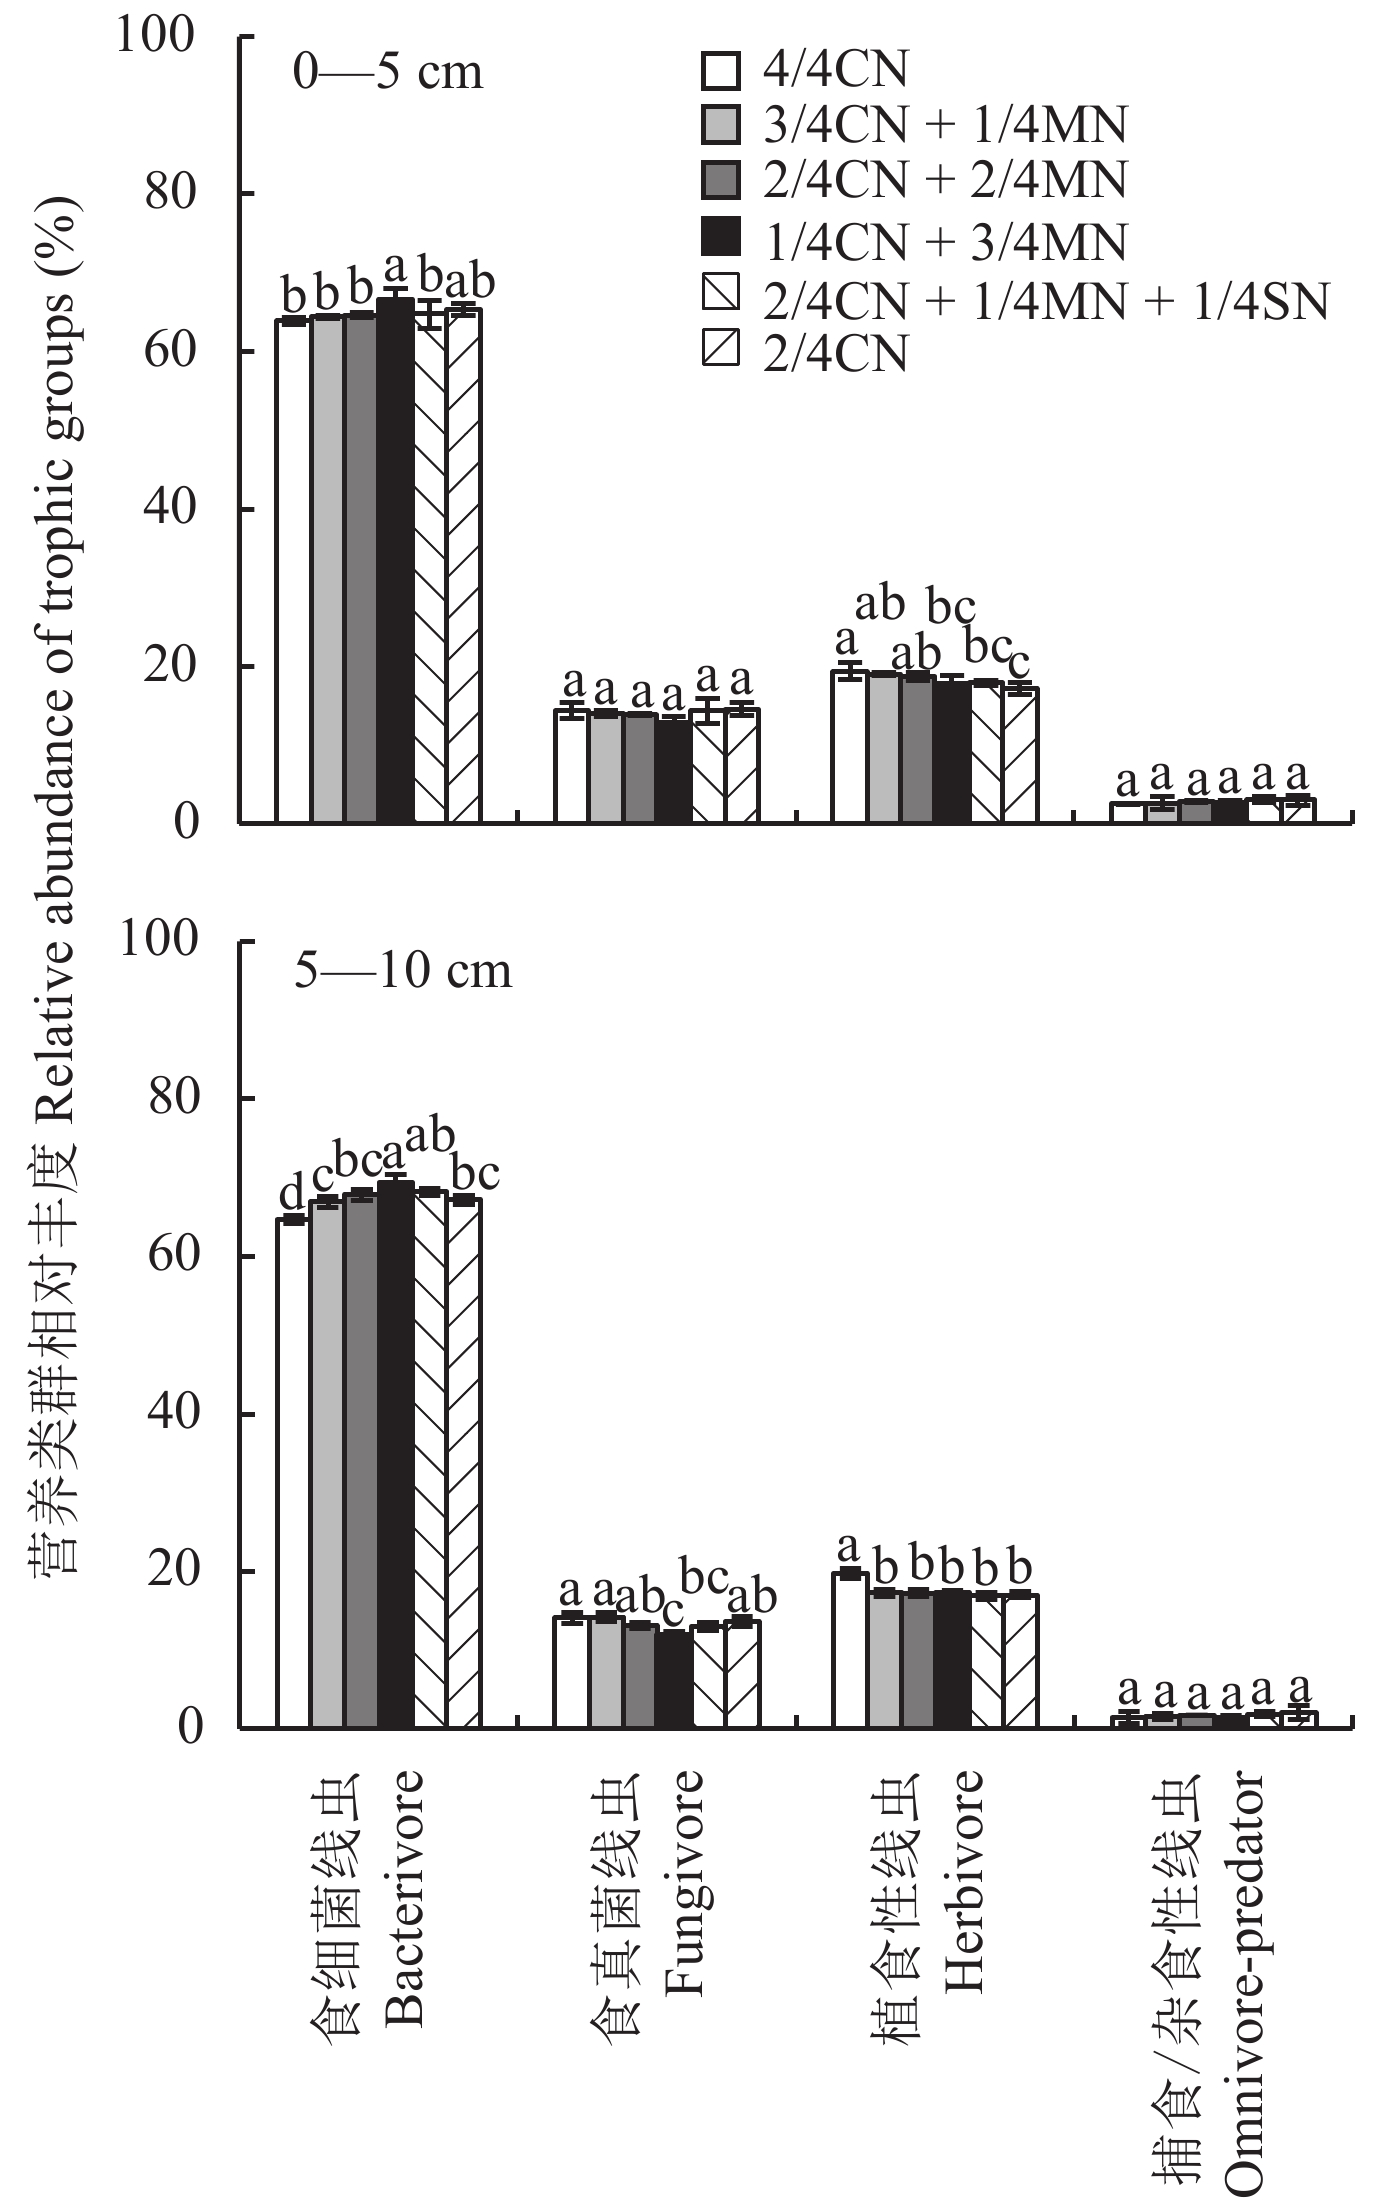
在已知线虫类群中,有益线虫包括食细菌、食真菌和捕食/杂食性线虫,有害线虫主要指植食性线虫。图1表明,在土壤线虫各营养类群中,食细菌线虫相对丰度最高,0—5和5—10 cm土层分别为63.8%~66.6%和64.7%~69.4%;食真菌线虫和植食性线虫次之,前者0—5和5—10 cm土层分别为12.9%~14.5%和11.9%~14.2%,后者分别为17.2%~19.3%和16.9%~19.7%;捕食/杂食性线虫相对丰度最低,0—5和5—10 cm土层分别为2.5%~3.1%和1.4%~2.1%。0—5 cm土层食细菌线虫、食真菌线虫、植食性线虫和捕食/杂食性线虫相对丰度平均分别为64.9%、14.0%、18.3%和2.8%,5—10 cm土层平均分别为67.4%、13.3%、17.6%和1.7%。
![]() 图 1 不同施肥模式下土壤消毒1年后不同土层线虫营养类群相对丰度[注(Note):柱上不同字母表示处理间差异显著 (P < 0.05) Different letters above the bars indicate significant difference among the fertilization treatments (P < 0.05).]Figure 1. The relative abundance of nematode trophic groups in different soil layers under different fertilization patterns after 1 year of soil disinfection
图 1 不同施肥模式下土壤消毒1年后不同土层线虫营养类群相对丰度[注(Note):柱上不同字母表示处理间差异显著 (P < 0.05) Different letters above the bars indicate significant difference among the fertilization treatments (P < 0.05).]Figure 1. The relative abundance of nematode trophic groups in different soil layers under different fertilization patterns after 1 year of soil disinfection2.2.1 土壤有益线虫个体数量及相对丰度
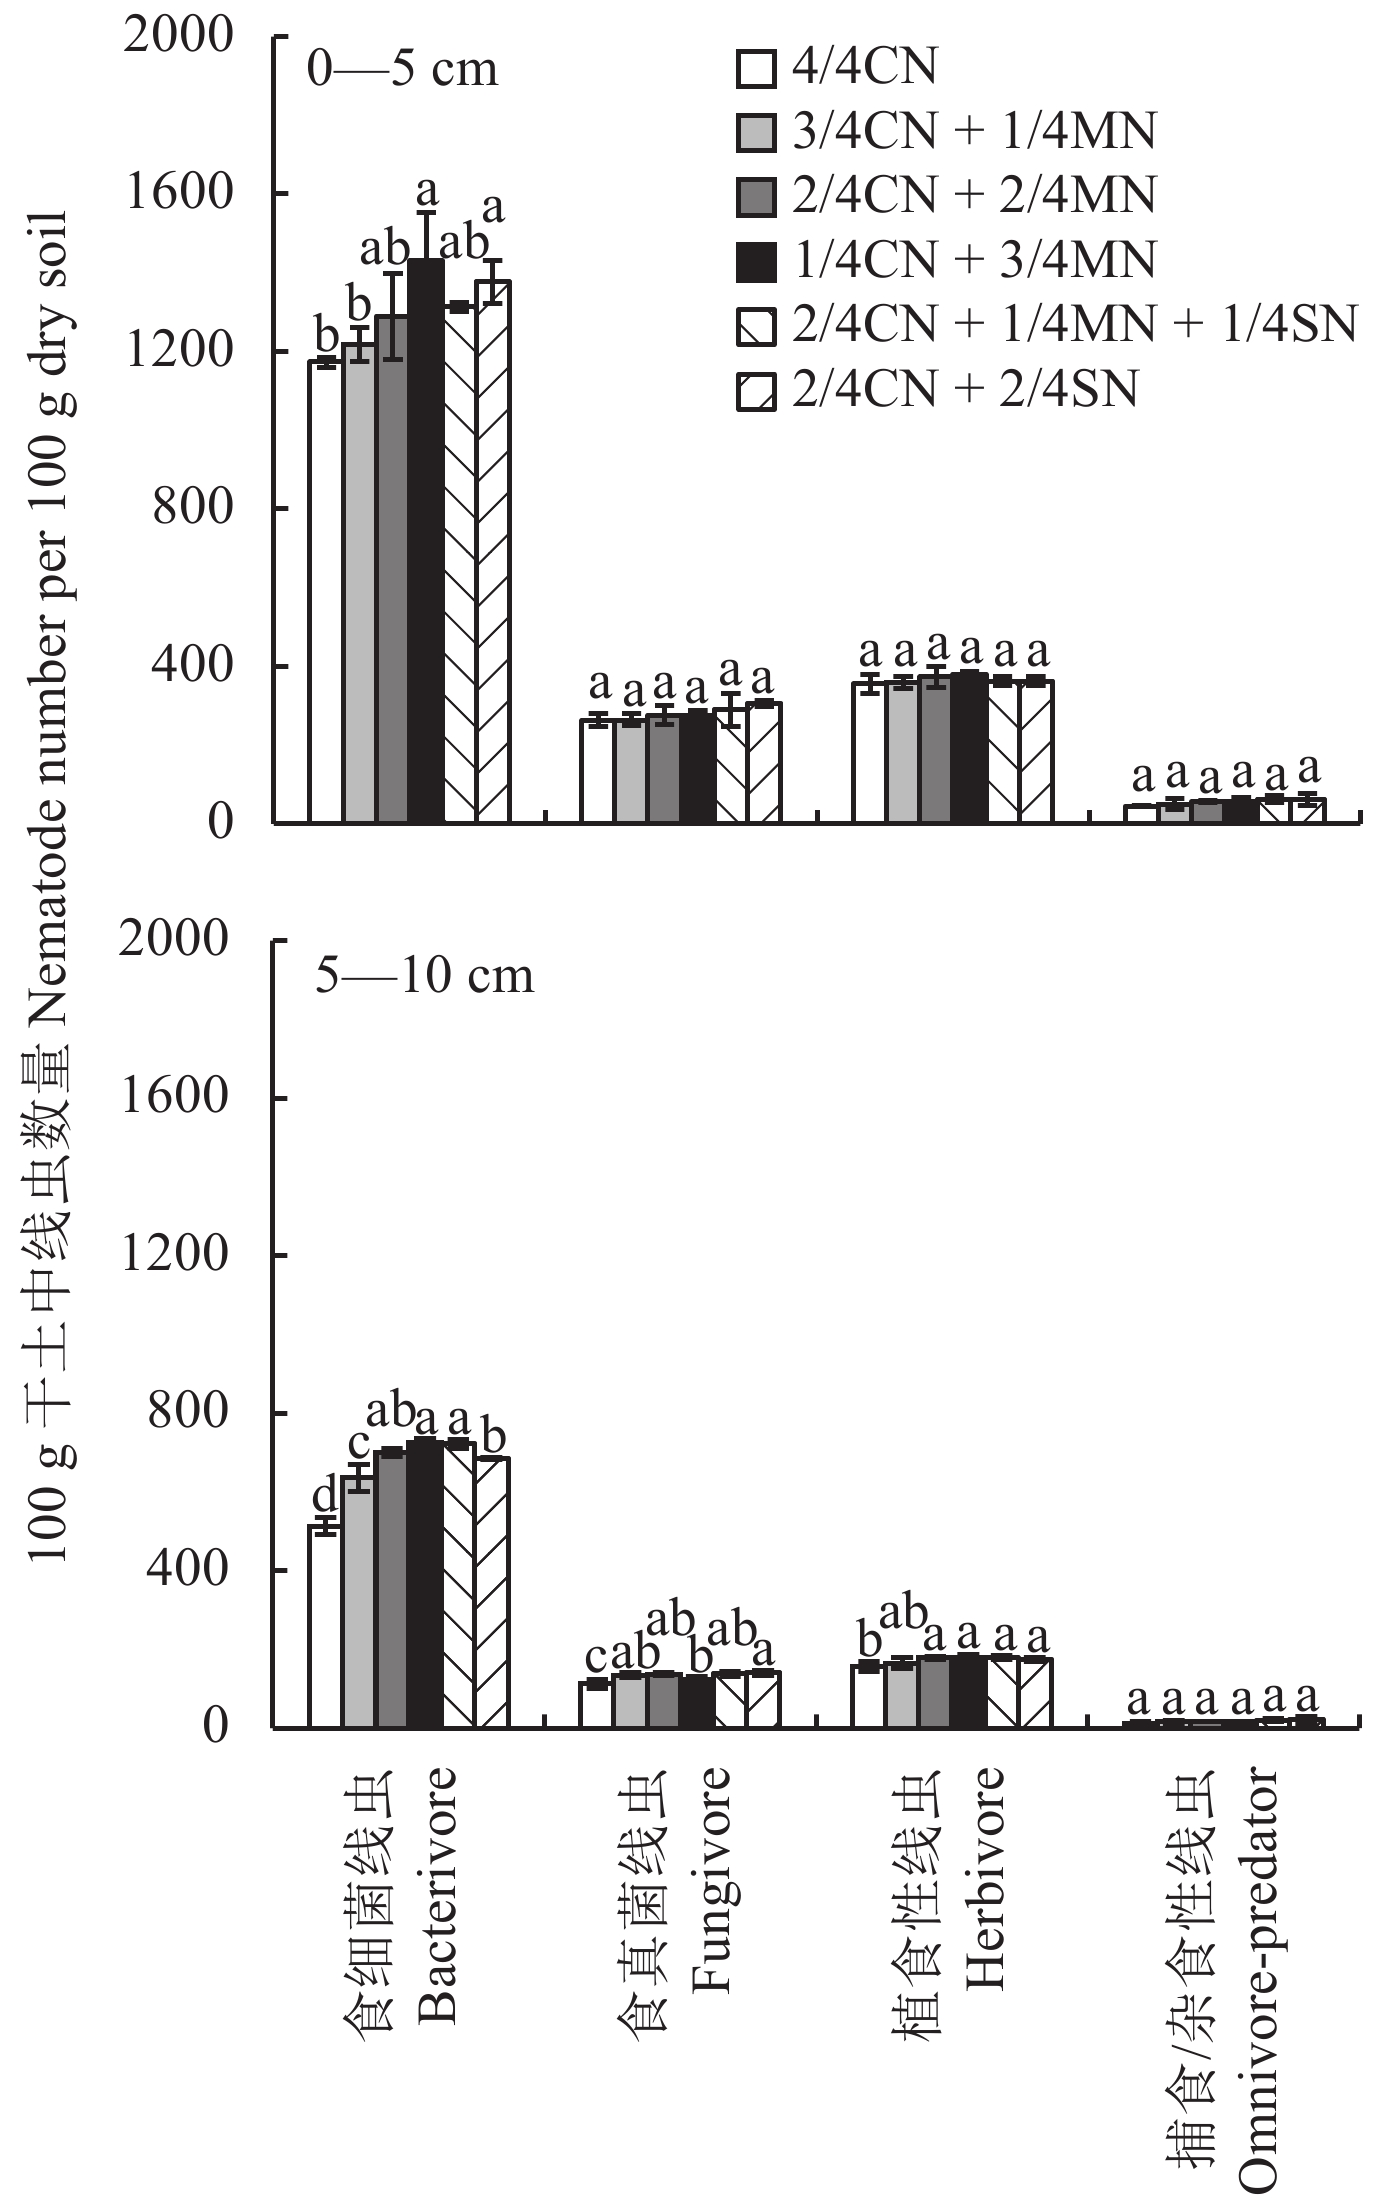
有机肥/秸秆替代化肥模式土壤食细菌线虫、食真菌线虫和捕食/杂食性线虫 (有益线虫) 数量总体上均高于单施化肥模式 (图2)。有机肥/秸秆替代化肥模式0—5 cm土层食细菌线虫、食真菌线虫和捕食/杂食性线虫数量较单施化肥模式平均分别增加13.0%、7.4%和26.7%,其中配施高量有机肥模式和配施秸秆模式的食细菌线虫、食真菌线虫和捕食/杂食性线虫数量增幅较大,平均分别增加17.0%、10.5%和33.6%;5—10 cm土层中,有机肥/秸秆替代化肥模式食细菌线虫、食真菌线虫和捕食/杂食性线虫数量较单施化肥模式平均分别增加35.5%、20.2%和56.5%,其中配施秸秆模式增幅较大,平均分别增加37.4%、23.9%和80.9%。
![]() 图 2 不同施肥模式下土壤消毒1年后不同土层线虫营养类群个体数量[注(Note):柱上不同的字母表示处理间差异显著 (P < 0.05) Different letters above the bars indicate significant difference among the fertilization treatments (P < 0.05).]Figure 2. The number of nenematode in different soil layers under different fertilization patterns after 1 year of soil disinfection
图 2 不同施肥模式下土壤消毒1年后不同土层线虫营养类群个体数量[注(Note):柱上不同的字母表示处理间差异显著 (P < 0.05) Different letters above the bars indicate significant difference among the fertilization treatments (P < 0.05).]Figure 2. The number of nenematode in different soil layers under different fertilization patterns after 1 year of soil disinfection图1表明,有机肥/秸秆替代化肥模式土壤食细菌线虫和捕食/杂食性线虫 (有益线虫) 相对丰度均高于单施化肥模式。有机肥/秸秆替代化肥模式0—5 cm土层食细菌线虫和捕食/杂食性线虫相对丰度较单施化肥模式平均分别增加2.0%和14.4%,其中配施高量有机肥模式和配施秸秆模式增幅较大,平均分别为2.7%和17.0%;5—10 cm土层食细菌线虫和捕食/杂食性线虫相对丰度较单施化肥模式平均分别增加5.0%和19.1%,其中2/4CN + 1/4MN + 1/4SN模式增幅较大,分别为5.4%和29.9%。有机肥/秸秆替代化肥模式0—5和5—10 cm土层有益线虫 (食细菌、食真菌和捕食/杂食性线虫) 相对丰度分别在81.0%~82.8%和82.7%~83.1%,较单施化肥模式平均分别增加1.5%和3.2%。
2.2.2 土壤有害线虫个体数量及相对丰度
虽然有机肥/秸秆替代化肥模式土壤植食性线虫 (有害线虫) 数量高于单施化肥模式,但其相对丰度低于单施化肥模式 (图1、图2)。有机肥/秸秆替代化肥模式0—5 cm土层植食性线虫数量为每100 g干土360~381条,较单施化肥模式平均增加3.4%;而植食性线虫相对丰度为17.2%~19.0%,较单施化肥模式平均降低6.3%,其中配施高量有机肥模式和配施秸秆模式植食性线虫相对丰度降幅较大,平均降幅为8.9%;5—10 cm土层植食性线虫数量为每100 g干土165~180条,较单施化肥模式平均增加12.0%,而植食性线虫相对丰度为16.9%~17.3%,较单施化肥模式平均降低13.1%,其中配施高量有机肥模式和配施秸秆模式植食性线虫相对丰度降幅较大,平均降幅为13.6%。
2.3 有机肥/秸秆替代化肥模式对设施菜田土壤线虫群落组成的影响
从表3可以看出,0—5 cm土层共鉴定土壤线虫17科29属,其中食细菌线虫9属,食真菌线虫7属,植食性线虫7属,捕食/杂食性线虫6属;有机肥/秸秆替代化肥模式土壤线虫总属数高于单施化肥模式,配施中量、高量有机肥模式和配施秸秆模式均为26属,配施低量有机肥模式为24属,单施化肥模式为22属。5—10 cm土层共鉴定土壤线虫17科25属,其中食细菌线虫7属,食真菌线虫6属,植食性线虫6属,捕食/杂食性线虫6属;中量、高量有机替代模式 (2/4CN + 2/4MN、1/4CN + 3/4MN、2/4CN + 1/4MN + 1/4SN和2/4CN + 2/4SN模式) 土壤线虫总属数高于低量有机替代模式 (3/4CN + 1/4MN) 和单施化肥模式,配施高量有机肥模式22属,中量有机替代模式18属,低量有机替代模式和单施化肥模式均为14属。
表 3 不同施肥模式土壤消毒1年后不同土层线虫群落组成及相对丰度(%)Table 3. The community composition and relative abundance of nematode in different soil layers under different fertilization patterns after 1 year of soil disinfection类群 (属)
Groups (Genus)c–p 4/4CN 3/4CN +1/4MN
2/4CN + 2/4MN 1/4CN+3/4MN 2/4CN+1/4MN+1/4SN
2/4CN +2/4SN 0—5
cm5—10
cm0—5
cm5—10
cm0—5
cm5—10
cm0—5
cm5—10
cm0—5
cm5—10
cm0—5
cm5—10
cm食细菌线虫 (有益线虫) Bacterivore (beneficial nematodes) 小杆属Rhabditis 1 15.2 12.0 6.0 8.4 7.0 7.4 9.9 10.8 13.5 16.2 20.5 12.0 原杆属Protorhabditis 1 7.6 5.1 13.8 14.2 12.2 10.4 10.8 9.3 6.5 6.4 5.3 2.0 盆咽属Panagrolaimus 1 1.6 4.7 5.0 0.0 6.0 5.1 6.6 4.2 5.9 1.2 3.2 8.9 绕线属Plectus 2 0.0 0.0 2.3 6.2 1.6 6.5 4.8 7.1 2.5 5.3 0.9 12.1 头叶属Cephalobus 2 25.9 17.5 24.1 14.9 22.3 7.8 16.5 12.9 20.2 7.2 23.1 8.1 真头叶属Eucephalobus 2 1.8 0.0 3.5 0.0 1.6 0.0 2.3 0.0 1.6 0.0 3.4 0.0 拟丽突属Acrobeloides 2 6.2 16.0 5.5 11.1 7.6 12.2 10.3 16.2 9.9 12.5 3.4 15.6 板唇属Chiloplacus 2 5.2 9.4 4.3 12.1 5.1 18.5 3.7 8.8 4.5 19.5 5.5 8.5 鹿角唇属Cervidellus 2 0.0 0.0 0.0 0.0 1.2 0.0 1.7 0.0 0.0 0.0 0.0 0.0 食真菌线虫 (有益线虫) Fungivore (beneficial nematodes) 柄端球属Paurodontus 2 0.0 0.0 1.8 0.0 0.0 0.0 0.0 0.0 0.0 0.0 1.1 0.0 茎属Ditylenchus 2 1.7 0.0 0.6 0.6 0.6 1.2 1.1 1.5 5.1 2.9 2.8 1.9 伪垫刃属Nothotylenchus 2 6.1 0.0 1.0 0.0 2.0 2.6 0.6 4.0 1.0 0.0 1.0 0.0 滑刃属Aphelenchoides 2 1.8 1.7 2.9 3.2 2.3 4.3 0.6 2.1 1.8 7.0 2.5 3.9 真滑刃属Aphelenchus 2 4.0 12.4 3.1 10.4 3.0 5.1 3.4 3.3 2.3 3.1 1.9 3.8 拟矛线属Dorylaimoides 4 0.2 0.0 0.0 0.0 0.0 0.0 2.5 0.5 1.2 0.0 5.2 0.0 短矛属Doryllium 4 0.5 0.0 4.5 0.0 6.0 0.0 4.8 0.5 2.9 0.0 0.0 4.0 植食性线虫 (有害线虫) Herbivore (harmful nematodes) 异球属Stictylus 2 0.0 0.0 0.0 0.0 0.6 0.0 0.6 0.0 0.8 0.0 1.1 0.0 针属Paratylenchus 2 3.5 0.7 3.3 0.0 1.6 0.0 0.0 0.0 2.4 0.0 0.6 0.0 垫刃属Tylenchus 2 4.3 9.8 1.2 0.0 3.2 1.0 0.8 5.6 2.7 2.1 2.2 1.3 裸矛属Psilenchus 3 5.6 3.2 7.1 11.1 5.8 9.9 8.9 5.4 4.5 7.6 5.9 8.3 短体属Pratylenchus 3 1.3 0.3 2.0 0.9 2.2 4.5 2.3 3.0 0.8 0.4 2.8 0.0 矮化属Tylenchorhynchus 3 4.1 5.9 3.7 5.3 3.6 1.9 0.4 3.3 4.6 6.3 2.7 2.7 头垫刃属Tetylenchus 3 0.6 0.0 1.6 0.0 1.8 0.0 4.8 0.0 2.2 0.6 1.9 4.7 捕食/杂食性线虫 (有益线虫) Omnivore-predator (beneficial nematodes) 锉齿属Mylonchulus 4 1.1 0.0 1.0 0.0 0.6 0.0 0.4 0.2 0.0 0.0 0.4 0.0 等齿属Miconchus 4 0.8 1.4 0.4 0.6 0.4 0.4 0.6 0.2 0.8 0.0 0.4 0.6 类矛线属Amphidorylaimus 4 0.6 0.0 0.0 0.0 0.6 0.0 0.6 0.0 0.0 0.0 0.6 0.6 矛线属Dorylaimus 5 0.0 0.0 0.0 0.0 0.0 0.6 0.0 0.4 0.6 0.4 0.0 0.0 孔咽属Aporcelaimus 5 0.0 0.0 0.4 0.0 0.6 0.0 0.6 0.0 0.6 0.9 0.9 0.0 扁腔属Sectonema 5 0.0 0.0 0.8 0.9 0.8 0.8 0.6 0.2 0.6 0.6 0.7 0.9 颚针属Belondira 5 0.0 0.0 0.0 0.0 0.0 0.0 0.0 0.5 0.6 0.0 0.0 0.0 注(Note):c-p—生活史对策 Colonizer-persister; 相对丰度 > 10% 为优势属, 1% ≤ 相对丰度 ≤ 10% 为常见属, 相对丰度 < 1% 为稀有属Relative abundance > 10% means dominants; 1% ≤ relative abundance ≤ 10% means ordinary; relative abundance < 1% means rare. 不同施肥模式0—5 cm土层共有优势属为头叶属,相对丰度在16.5%~25.9%。有机肥/秸秆替代化肥模式头叶属相对丰度均低于单施化肥模式,其相对丰度在16.5%~24.1%,较单施化肥模式降低6.9%~36.3%,其中配施高量有机肥模式降幅最大。随有机肥用量的增加,头叶属相对丰度呈降低的趋势,与配施低量和中量有机肥模式相比,配施高量有机肥模式分别低7.4%和31.6%。5—10 cm土层共有优势属为拟丽突属,相对丰度为11.1%~16.2%。随有机肥用量的增加,拟丽突属相对丰度呈增加的趋势,与配施低量和中量有机肥模式相比,配施高量有机肥模式分别提高46.3%和33.4%。
不同施肥模式0—5 cm土层线虫优势属各不相同,单施化肥模式的优势属是小杆属和头叶属,相对丰度分别为15.2%和25.9%;配施低量有机肥模式的优势属是原杆属和头叶属,相对丰度分别为13.8%和24.1%;配施中量有机肥模式的优势属是原杆属和头叶属,相对丰度分别为12.2%和22.3%;配施高量有机肥模式的优势属是原杆属、头叶属和拟丽突属,相对丰度分别为10.8%、16.5%和10.3%;2/4CN + 1/4MN + 1/4SN模式的优势属是小杆属和头叶属,相对丰度分别为13.5%和20.2%;2/4CN + 2/4SN模式的优势属是小杆属和头叶属,相对丰度分别为20.5%和23.1%。5—10 cm土层线虫优势属亦有所差异,单施化肥模式的优势属是小杆属、头叶属、拟丽突属和真滑刃属,相对丰度分别为12.0%、17.5%、16.0%和12.4%;配施低量有机肥模式的优势属是原杆属、头叶属、拟丽突属、板唇属、真滑刃属和裸矛属,相对丰度分别为14.2%、14.9%、11.1%、12.1%、10.4%和11.1%;配施中量有机肥模式的优势属是原杆属、拟丽突属和板唇属,相对丰度分别为10.4%、12.2%和18.5%;配施高量有机肥模式的优势属是小杆属、头叶属和拟丽突属,相对丰度分别为10.8%、12.9%和16.2%;2/4CN + 1/4MN + 1/4SN模式的优势属是小杆属、拟丽突属和板唇属,相对丰度分别为16.2%、12.5%和19.5%;2/4CN + 2/4SN模式的优势属是小杆属、绕线属和拟丽突属,相对丰度分别为12.0%、12.1%和15.6%。
不同施肥模式0—5 cm土层绕线属、孔咽属和扁腔属在单施化肥模式中没有出现;锉齿属在2/4CN + 1/4MN + 1/4SN模式中消失;矛线属和颚针属只存在于2/4CN + 1/4MN + 1/4SN模式中,鹿角唇属只存在于配施中量、高量有机肥模式中;柄端球属只存在于配施低量有机肥模式与2/4CN + 2/4SN模式中;拟矛线属只存在于单施化肥模式、配施高量有机肥模式与配施秸秆模式中。5—10 cm土层盆咽属在配施低量有机肥模式中消失;绕线属、茎属和扁腔属在单施化肥模式中消失;针属只在单施化肥模式中出现;拟矛线属和颚针属只出现在配施高量有机肥模式;类矛线属只出现在2/4CN + 2/4SN模式。
2.4 有机肥/秸秆替代化肥模式对设施菜田土壤线虫生态指数的影响
由于土壤线虫对土壤环境变化敏感,其群落可以稳定、综合地反映土壤食物网结构和功能的变化[23]。本研究主要选取了8种生态指数,评价线虫物种多样性、群落结构特征和功能多样性 (表4)。
2.4.1 土壤线虫物种多样性指数
香农多样性指数 (H′) 和优势度指数 (λ) 可以用来表征土壤线虫的物种多样性特征[40]。H′值越大,表明土壤线虫种属越丰富。有机肥/秸秆替代化肥模式0—5和5—10 cm土层H′值均高于单施化肥模式,表明有机肥/秸秆替代化肥模式0—5和5—10 cm土层土壤线虫物种更丰富。有机肥/秸秆替代化肥模式0—5 cm土层H′值在1.13~1.19,平均为1.16,较单施化肥模式平均增加6.6%,其中配施高量有机肥模式和2/4SN + 1/4MN + 1/4SN模式增幅较大,分别为8.8%和7.8%。5—10 cm土层H′值在1.01~1.11,平均为1.07,较单施化肥模式平均增加7.0%,其中配施高量有机肥模式和2/4CN + 2/4SN模式增幅较大,分别为11.4%和10.3%。
λ值越大,表明土壤线虫优势属在群落中发挥更大的作用。配施有机肥模式和2/4CN + 1/4MN + 1/4SN模式0—5和5—10 cm土层λ值均高于单施化肥模式,表明配施有机肥模式优势属在群落中的作用更大。其中配施高量有机肥模式0—5和5—10 cm土层λ值增幅较大,分别为4.0%和2.5%。
2.4.2 土壤线虫群落结构指数
自由生活线虫成熟度指数 (MI)、植物寄生线虫成熟度指数 (PPI) 和瓦斯乐斯卡指数 (WI) 可以用来描述土壤线虫营养类群和生活史多样性,评价土壤线虫对外界扰动的响应及土壤的健康状况[29]。MI可以表明土壤环境所受的干扰程度,MI值越低,表明土壤环境受到干扰程度越大。有机肥/秸秆替代化肥模式0—5和5—10 cm土层MI值高于单施化肥模式,表明土壤环境受外界扰动较低。有机肥/秸秆替代化肥模式0—5 cm土层MI值在1.80~1.82,较单施化肥模式增加3.4%~4.6%,其中配施高量有机肥模式和配施秸秆模式增幅较大 (平均为3.9%);5—10 cm土层MI值在1.75~1.80,较单施化肥模式平均增加0.4%~3.4%,其中配施高量有机肥模式和配施秸秆模式增幅较大 (平均为1.8%)。
PPI是基于植食性线虫的成熟度指数,该指数与土壤肥力及作物产量密切相关,该值越低,说明对植物寄生性线虫的生存条件影响越小。有机肥/秸秆替代化肥模式0—5和5—10 cm土层PPI值高于单施化肥模式,表明有机肥/秸秆替代化肥模式对植食性线虫的影响较大。有机肥/秸秆替代化肥模式0—5 cm土层PPI值在2.39~2.43,较单施化肥模式增加3.3%~5.1%;5—10 cm土层PPI值在2.36~2.44,较单施化肥模式增加2.2%~5.3%。
WI用于反映土壤线虫群落组成和土壤的健康程度,WI值越大,表明土壤矿化途径主要由食细菌线虫和食真菌线虫参与,土壤健康程度越高。有机肥/秸秆替代化肥模式0—5和5—10 cm土层WI值均高于单施化肥模式,反映有机肥/秸秆替代化肥模式土壤中食细菌线虫和食真菌线虫相对占优势,土壤处于相对健康状态。有机肥/秸秆替代化肥模式0—5 cm土层WI值在4.12~4.65,平均为4.37,较单施化肥模式增加7.9%,其中配施高量有机肥模式和配施秸秆模式增幅较大 (平均为11.5%)。5—10 cm土层WI值在4.68~4.81,平均为4.73,较单施化肥模式增加18.5%,其中配施高量有机肥模式和配施秸秆模式增幅较大 (平均为19.1%)。
2.4.3 土壤线虫功能性指数
在土壤线虫营养结构方面,富集指数 (EI)、通道指数 (CI) 和结构指数 (SI) 可以反映出线虫对食物资源的预期响应,衡量食物网结构复杂性[41]。EI主要用于评估食物网对可利用资源的响应,该值高则说明土壤线虫可利用的养分资源较为丰富,对作物有正向影响。有机肥/秸秆替代化肥模式0—5和5—10 cm土层EI值均高于单施化肥模式,表明有机肥/秸秆替代化肥模式土壤线虫可利用的养分资源较多。有机肥/秸秆替代化肥模式0—5 cm土层EI值在68.9~73.3,较单施化肥模式平均增加4.7%,其中配施高量有机肥模式和配施秸秆模式增幅较大 (平均为6.2%);5—10 cm土层EI值在64.1~65.9,较单施化肥模式平均增加1.7%,其中配施高量有机肥模式和配施秸秆模式增幅较大 (平均为2.4%)。
CI为反映线虫分解途径的指数,该值越高,表明食真菌通道优势明显。有机肥/秸秆替代化肥模式0—5和5—10 cm土层CI值均低于单施化肥模式,表明有机肥/秸秆替代化肥模式食真菌通道优势更低。0—5 cm土层有机肥/秸秆替代化肥模式CI值在4.9~8.9,平均为7.5,较单施化肥模式降低39.6%,其中配施高量有机肥模式降幅最大 (60.4%);5—10 cm土层CI值在9.5~13.6,平均为11.6,较单施化肥模式降低17.4%,其中2/4CN + 2/4SN模式降幅最大 (31.8%)。
SI可以指示在干扰或恢复过程中土壤食物网结构的变化,其值越高,表示线虫食物链越长,土壤食物网越复杂。有机肥/秸秆替代化肥模式0—5和5—10 cm土层SI值均高于单施化肥模式,表明有机肥/秸秆替代化肥模式食物链更长。有机肥/秸秆替代化肥模式0—5 cm土层SI值在38.9~48.6,平均为43.3,较单施化肥模式增加125.1%,其中配施高量有机肥模式和配施秸秆模式增幅较大 (平均为130.4%);5—10 cm土层SI值在12.3~32.4,较单施化肥模式增加34.0%~253.5%,其中配施高量有机肥模式和配施秸秆模式增幅较大 (平均为138.7%)。
表 4 不同施肥模式土壤消毒1年后不同土层线虫生态指数Table 4. The ecological indices of nematode community in different layers under different fertilization patterns after 1 year of soil disinfection项目
Item4/4CN 3/4CN + 1/4MN 2/4CN + 2/4MN 1/4CN + 3/4MN 2/4CN + 1/4MN + 1/4SN 2/4CN + 2/4SN 0—5 cm 5—10 cm 0—5 cm 5—10 cm 0—5 cm 5—10 cm 0—5 cm 5—10 cm 0—5 cm 5—10 cm 0—5 cm 5—10 cm H′ 1.09 ± 0.00 c 1.00 ± 0.01 d 1.15 ± 0.03 ab 1.01 ± 0.01 cd 1.17 ± 0.02 a 1.08 ± 0.01 b 1.19 ± 0.01 a 1.11 ± 0.01 a 1.18 ± 0.03 a 1.03 ± 0.03 c 1.13 ± 0.00 bc 1.10 ± 0.01 ab λ 0.88 ± 0.01 d 0.88 ± 0.00 c 0.90 ± 0.01 bcd 0.89 ± 0.00 c 0.90 ± 0.01 abc 0.90 ± 0.00 b 0.92 ± 0.00 a 0.91 ± 0.00 ab 0.91 ± 0.01 ab 0.89 ± 0.01 c 0.88 ± 0.00 cd 0.91 ± 0.00 a MI 1.74 ± 0.02 b 1.74 ± 0.02 a 1.80 ± 0.01 a 1.77 ± 0.03 ab 1.81 ± 0.04 a 1.76 ± 0.03 ab 1.81 ± 0.00 a 1.75 ± 0.03 b 1.82 ± 0.03 a 1.77 ± 0.02 ab 1.80 ± 0.01 a 1.80 ± 0.01 a PPI 2.31 ± 0.08 a 2.31 ± 0.04 a 2.39 ± 0.06 a 2.36 ± 0.11 a 2.41 ± 0.12 a 2.37 ± 0.07 a 2.42 ± 0.02 a 2.37 ± 0.03 a 2.42 ± 0.18 a 2.43 ± 0.23 a 2.43 ± 0.02 a 2.44 ± 0.09 a WI 4.05 ± 0.27 c 3.99 ± 0.10 b 4.12 ± 0.03 bc 4.68 ± 0.15 a 4.20 ± 0.14 bc 4.70 ± 0.15 a 4.48 ± 0.31 ab 4.71 ± 0.14 a 4.41 ± 0.08 abc 4.81 ± 0.12 a 4.65 ± 0.22 a 4.75 ± 0.12 a EI 67.6 ± 1.6 c 63.9 ± 2.0 a 68.9 ± 2.9 bc 64.1 ± 2.5 a 69.7 ± 1.9 bc 64.3 ± 1.7 a 71.9 ± 1.1 ab 65.9 ± 1.6 a 69.9 ± 0.8 bc 65.3 ± 1.8 a 73.3 ± 0.3 a 65.2 ± 1.0 a CI 12.3 ± 1.1 a 14.0 ± 1.4 a 8.8 ± 1.7 b 13.6 ± 0.7 a 7.3 ± 0.6 b 12.5 ± 0.4 a 4.9 ± 0.5 c 10.1 ± 0.9 b 8.9 ± 1.3 b 12.1 ± 1.1 a 7.4 ± 0.3 b 9.5 ± 1.4 b SI 19.2 ± 1.9 c 9.2 ± 4.9 c 38.9 ± 7.6 b 12.3 ± 3.0 bc 44.6 ± 2.2 ab 13.0 ± 1.0 bc 48.6 ± 0.2 a 17.3 ± 2.0 b 39.8 ± 3.0 b 16.0 ± 1.8 bc 44.5 ± 0.7 ab 32.4 ± 7.4 a 注(Note):H′—香农多样性指数 Shannon-weaver index; λ—优势度指数 Simpson index; MI—自由生活线虫成熟度指数 Maturity index; PPI—植食性线虫成熟度指数 Plant-parasitic index; WI—瓦斯乐斯卡指数 Wasilewska index; EI—富集指数 Enrichment index; CI—通道指数 Channel index; SI—结构指数 Structural index; 同行数据后不同小写字母表示处理间差异显著 (P < 0.05) Values followed by different letters in a row indicate significant difference among treatments (P < 0.05). 3. 讨论
3.1 不同施肥模式对设施菜田土壤线虫总数的影响
土壤线虫总数受土壤中有机质、养分含量及物理性状等因素深刻影响。费冲[42]研究发现,土壤线虫总数与土壤有机质及养分含量间呈显著正相关。胡宁[43]指出土壤中良好的孔隙状况对线虫的生长至关重要;王邵军等[44]研究表明,土壤线虫数量与土壤孔隙度之间具有极显著正相关关系。本研究结果显示,土壤有益线虫的相对丰度在80.3%~83.1%;土壤消毒1年后,有机肥/秸秆替代化肥模式0—5、5—10和10—20 cm土层土壤线虫总数较单施化肥模式分别增加16.8%、31.8%和11.2%,且随着有机肥施用量的增加,不同土层土壤线虫总数均呈增加的趋势,其中以配施高量有机肥模式和配施秸秆模式效果更好。林英华等[45]研究表明,土壤线虫的生长很大程度上受土壤有机质含量的影响,二者呈现一定的正相关性。前人研究表明,有机肥/秸秆中富含大量的碳资源,其投入土壤后不仅为线虫提供充足的“食物”(碳及氮等资源),而且对土壤结构也有极大的改善作用 (如降低容重、增加孔隙度),为土壤线虫的生存提供较好的“微环境”[46-49];而长期单施化肥模式导致土壤酸化和次生盐渍化[10],加速土壤中碳素的矿化[45],减少土壤微生物的数量,抑制土壤线虫的生长[50-51]。因此,有机肥/秸秆替代化肥模式不同土层中土壤线虫总数均高于单施化肥模式。
本研究中,相较于配施秸秆模式,配施高量有机肥模式不同土层土壤线虫总数相对较高。为何在高碳投入 (配施秸秆模式) 土壤中线虫总数低于低碳投入 (配施高量有机肥模式) 土壤?这可能归因于有机肥与秸秆的性质差异。李季等[52]认为秸秆作为高碳氮比、富含木质素等的耐降解物料,相对于有机肥 (易降解、低碳氮比、富含易矿化碳) 而言较难降解。在本研究中,玉米秸秆碳氮比为25.8∶1,虽然配施秸秆模式中碳资源数量较多,但由于其耐降解程度高,较难被线虫利用;而有机肥碳氮比为11.9∶1,且富含较多的易降解碳资源,施入土壤后能为土壤线虫提供更多的“易利用”碳,从而更好地促进土壤线虫的生长。因此,虽然配施秸秆模式土壤中碳投入量高于配施高量有机肥模式,但其投入碳的耐降解性相对较高,故配施高量有机肥模式土壤线虫总数高于配施秸秆模式。另外,土壤消毒1年后土壤线虫的表聚现象明显,即土壤线虫总数表现为0—5 cm土层 > 5—10 cm土层 > 10—20 cm土层 (土层间差异显著),这可能是由于随着土层的加深,土壤透气性变差,土壤有机质含量降低,抑制土壤线虫的生长[53]。
3.2 不同施肥模式对设施菜田土壤线虫营养类群的影响
土壤食物网根据营养能量来源,可以分为细菌通道、真菌通道和植物通道。细菌、食细菌线虫为细菌通道,真菌、食真菌线虫为真菌通道,植物、植食性线虫为植物通道[49]。本研究结果表明,设施菜田有机肥/秸秆替代化肥模式土壤有益线虫营养类群 (食细菌线虫、食真菌线虫和捕食/杂食性线虫) 个体数量高于单施化肥模式。这是因为有机肥/秸秆的投入一方面能够持续稳定提供地土壤碳源和氮源,提高微生物 (真菌、细菌) 数量,为处于细菌通道和真菌通道的食细菌线虫和食真菌线虫提供丰富的食物来源;另一方面能够降低土壤容重,提高土壤孔隙度与含水量,有利于土壤捕食/杂食性线虫运动及捕食[51]。我们还发现配施高量有机肥模式土壤食细菌线虫数量较配施秸秆模式更高,而配施秸秆模式土壤食真菌线虫数量较配施高量有机肥模式更高。Wallenstein等[54]研究表明,细菌的碳氮比为6∶1,主要负责降解易降解碳,而真菌碳氮比为15∶1,对耐降解碳的降解能力更强。因此,二者可能对不同有机肥类型的响应不同,细菌对有机肥 (易降解物料) 的响应更迅速,而真菌对秸秆 (耐降解物料) 的响应更迅速,这可能是解释食细菌线虫和食真菌线虫在不同施肥模式间存在差异的原因[52, 55-56]。本研究结果还表明,有机肥/秸秆替代化肥模式土壤植食性线虫数量虽然高于单施化肥模式,但其相对丰度低于单施化肥模式,说明有机肥/秸秆替代化肥模式对土壤有害的植食性线虫有一定的抑制作用。这与相关研究结果基本一致,林琳等[53]认为,有机肥/秸秆的施入提高土壤食细菌线虫相对丰度,增强食细菌线虫与植食性线虫竞争生态位的能力,同时土壤植食性线虫的食物来源主要为植物根系,其食物来源和数量不如食细菌线虫广泛,从而降低土壤植食性线虫的相对丰度。
3.3 不同施肥模式对土壤线虫生态指数的影响
土壤线虫群落生态指标对不同施肥模式的响应存在差异,利用土壤线虫的生态指数可以反映不同施肥模式对土壤线虫多样性和群落结构的影响。本试验研究表明,有机肥/秸秆替代化肥模式H′值高于单施化肥模式,这是因为有机肥/秸秆中碳源的形式多样,从而增加土壤微生物多样性[57],使土壤线虫多样性增加[29];同时有机肥/秸秆替代化肥模式λ值高于单施化肥模式,这是由于不同微生物对于碳源的选择性不同,有机肥/秸秆的施用导致微生物的优势类群不同,这必然会使得某些线虫属迅速发展,增加线虫优势属的数量。
前人对MI和WI的研究结果不一,叶成龙等[58]认为有机肥的施入可提高土壤线虫群落MI值,而刘婷[59]认为有机肥的施入可降低MI值。本研究结果表明,有机肥/秸秆替代化肥模式MI值和WI值均高于单施化肥模式,表明有机肥/秸秆的施入对土壤环境的干扰程度较低,明显促进食细菌线虫并抑制植食性线虫的繁殖,进一步说明有机肥/秸秆的施入不但使土壤食物网向健康方向转变,而且可以保持土壤生态环境的稳定。
孔云[60]的研究结果表明,有机肥的施入可提高土壤线虫的EI值和SI值。本研究也发现,有机肥/秸秆替代化肥模式EI值和SI值均高于单施化肥模式,而有机肥/秸秆替代化肥模式土壤通道指数 (CI) 低于单施化肥模式,表明有机肥/秸秆的施用改善了土壤养分状况,增加了土壤线虫的食物供应,降低了食真菌线虫参与土壤有机质分解和营养转化效率,增加了土壤食物网的相对连通性,使土壤线虫群落结构与功能复杂化。
从试验结果来看,有机肥/秸秆替代化肥模式不仅能够提高食物网稳定性和维持土壤食物网功能,而且可以降低对土壤环境的干扰程度,缓冲土壤压力,其中配施高量有机肥模式和配施秸秆模式表现较好,综合定位试验9年产量数据 (2/4CN + 1/4MN + 1/4SN模式产量最高) [61]和本试验土壤线虫群落相关结果,在设施蔬菜生产上推荐化肥—有机肥―秸秆 (2/4CN + 1/4MN + 1/4SN) 配施模式。
4. 结论
有机肥/秸秆替代化肥模式,尤其是配施高量有机肥模式和配施秸秆模式,可促进土壤线虫,尤其是有益线虫的生长,同时对土壤植食性线虫有一定的抑制作用。有机肥/秸秆替代化肥模式0—5、5—10和10—20 cm土层土壤线虫总数均高于单施化肥模式,平均分别增加16.8%、31.8%和11.2%,其中,以配施高量有机肥模式和配施秸秆模式土壤线虫总数较高,较单施化肥模式对应土层增幅分别为12.1%~26.4%、34.3%~42.8%、13.2%~18.3%;有机肥/秸秆替代化肥模式土壤有益线虫 (食细菌、食真菌和捕食/杂食性线虫) 数量高于单施化肥模式,土壤有害植食性线虫数量虽高于单施化肥模式,但其相对丰度低于单施化肥模式 (0—5和5—10 cm土层平均分别降低6.3%和13.1%)。
有机肥/秸秆替代化肥模式,尤其是配施高量有机肥模式和配施秸秆模式,还可提高土壤线虫群落的成熟度、稳定性和结构复杂性。有机肥/秸秆替代化肥模式自由生活线虫成熟度指数、瓦斯乐斯卡指数、富集指数和结构指数均高于单施化肥模式,其中,以配施高量有机肥模式和配施秸秆模式较高,0—5 cm土层平均分别增加3.9%、11.5%、6.2%和130.4%,5—10 cm土层平均分别增加1.8%、19.1%、2.4%和138.7%。
综合考虑蔬菜产量、土壤线虫群落相关指标以及实际可操作性,化肥与有机肥、秸秆配施模式 (2/4CN + 1/4MN + 1/4SN) 是设施蔬菜可持续高产的施肥模式。
-
![]()
图 1 不同施肥模式下土壤消毒1年后不同土层线虫营养类群相对丰度
[注(Note):柱上不同字母表示处理间差异显著 (P < 0.05) Different letters above the bars indicate significant difference among the fertilization treatments (P < 0.05).]
Figure 1. The relative abundance of nematode trophic groups in different soil layers under different fertilization patterns after 1 year of soil disinfection
![]()
图 2 不同施肥模式下土壤消毒1年后不同土层线虫营养类群个体数量
[注(Note):柱上不同的字母表示处理间差异显著 (P < 0.05) Different letters above the bars indicate significant difference among the fertilization treatments (P < 0.05).]
Figure 2. The number of nenematode in different soil layers under different fertilization patterns after 1 year of soil disinfection
表 1 试验处理及其氮和碳施用量 (kg/hm2)
Table 1 Treatments and the corresponding N and C inputs from different sources
处理
Treatment氮投入量N input 碳投入量C input 化肥
Chemical fertilizer有机肥
Organic manure秸秆
Corn straw合计氮
Total N有机肥
Organic manure秸秆
Corn straw合计碳
Total C春茬番茄季Spring tomato growing season 4/4CN 450.0 0 0 450.0 0 0 0 3/4CN + 1/4MN 337.5 112.5 0 450.0 1130 0 1130 2/4CN + 2/4MN 225.0 225.0 0 450.0 2260 0 2260 1/4CN + 3/4MN 112.5 337.5 0 450.0 3391 0 3391 2/4CN + 1/4MN + 1/4SN 225.0 112.5 112.5 450.0 1130 4618 5748 2/4CN + 2/4SN 225.0 0 225.0 450.0 0 9236 9236 秋冬茬芹菜季Autumn-winter celery growing season 4/4CN 450.0 0 0 450.0 0 0 0 3/4CN + 1/4MN 337.5 112.5 0 450.0 1130 0 1130 2/4CN + 2/4MN 225.0 225.0 0 450.0 2260 0 2260 1/4CN + 3/4MN 112.5 337.5 0 450.0 3391 0 3391 2/4CN + 1/4MN + 1/4SN 225.0 112.5 112.5 450.0 1130 4618 5748 2/4CN + 2/4SN 225.0 0 225.0 450.0 0 9236 9236  下载: 导出CSV
表 2 不同施肥模式下土壤消毒后不同时间各土层线虫总数[No./100 g, dry soil)]
Table 2 The total number of nematode in each soil layer under different fertilization patterns at differenttime after soil disinfection
处理
Treatment0—5 cm 5—10 cm 10—20 cm ASD ASD1 ASD ASD1 ASD ASD1 4/4CN 36 ± 1 a 1930 ± 20 Ac 32 ± 10 a 932 ± 105 Bb 34 ± 9 a 635 ± 38 Ca 3/4CN + 1/4MN 39 ± 8 a 2134 ± 43 Abc 28 ± 9 a 1050 ± 158 Bab 32 ± 4 a 670 ± 75 Ca 2/4CN + 2/4MN 49 ± 7 a 2300 ± 192 Aab 41 ± 4 a 1223 ± 164 Ba 42 ± 3 a 673 ± 75 Ca 1/4CN + 3/4MN 41 ± 3 a 2439 ± 242 Aa 35 ± 4 a 1284 ± 126 Ba 31 ± 6 a 751 ± 28 Ca 2/4CN + 1/4MN + 1/4SN 43 ± 11 a 2163 ± 86 Aabc 37 ± 10 a 1330 ± 221 Ba 41 ± 8 a 719 ± 112 Ca 2/4CN + 2/4SN 37 ± 6 a 2235 ± 166 Aab 30 ± 3 a 1252 ± 111 Ba 31 ± 1 a 719 ± 87 Ca 注(Note):ASD—土壤消毒后 After soil disinfection; ASD1—土壤消毒 1 年后 1 year after soil disinfection ; 同列数据后不同小写字母表示处理间差异显著 (P < 0.05) Values followed by different lowercase letters in the same column indicate significant difference among the fertilization treatments (P < 0.05); 同行数据后不同大写字母表示同一时期同一处理不同土层间差异显著 (P < 0.05) Values followed by different capital letters in the same row indicate significant difference among soil layers in the same period (P < 0.05).
下载: 导出CSV
表 3 不同施肥模式土壤消毒1年后不同土层线虫群落组成及相对丰度(%)
Table 3 The community composition and relative abundance of nematode in different soil layers under different fertilization patterns after 1 year of soil disinfection
类群 (属)
Groups (Genus)c–p 4/4CN 3/4CN +1/4MN
2/4CN + 2/4MN 1/4CN+3/4MN 2/4CN+1/4MN+1/4SN
2/4CN +2/4SN 0—5
cm5—10
cm0—5
cm5—10
cm0—5
cm5—10
cm0—5
cm5—10
cm0—5
cm5—10
cm0—5
cm5—10
cm食细菌线虫 (有益线虫) Bacterivore (beneficial nematodes) 小杆属Rhabditis 1 15.2 12.0 6.0 8.4 7.0 7.4 9.9 10.8 13.5 16.2 20.5 12.0 原杆属Protorhabditis 1 7.6 5.1 13.8 14.2 12.2 10.4 10.8 9.3 6.5 6.4 5.3 2.0 盆咽属Panagrolaimus 1 1.6 4.7 5.0 0.0 6.0 5.1 6.6 4.2 5.9 1.2 3.2 8.9 绕线属Plectus 2 0.0 0.0 2.3 6.2 1.6 6.5 4.8 7.1 2.5 5.3 0.9 12.1 头叶属Cephalobus 2 25.9 17.5 24.1 14.9 22.3 7.8 16.5 12.9 20.2 7.2 23.1 8.1 真头叶属Eucephalobus 2 1.8 0.0 3.5 0.0 1.6 0.0 2.3 0.0 1.6 0.0 3.4 0.0 拟丽突属Acrobeloides 2 6.2 16.0 5.5 11.1 7.6 12.2 10.3 16.2 9.9 12.5 3.4 15.6 板唇属Chiloplacus 2 5.2 9.4 4.3 12.1 5.1 18.5 3.7 8.8 4.5 19.5 5.5 8.5 鹿角唇属Cervidellus 2 0.0 0.0 0.0 0.0 1.2 0.0 1.7 0.0 0.0 0.0 0.0 0.0 食真菌线虫 (有益线虫) Fungivore (beneficial nematodes) 柄端球属Paurodontus 2 0.0 0.0 1.8 0.0 0.0 0.0 0.0 0.0 0.0 0.0 1.1 0.0 茎属Ditylenchus 2 1.7 0.0 0.6 0.6 0.6 1.2 1.1 1.5 5.1 2.9 2.8 1.9 伪垫刃属Nothotylenchus 2 6.1 0.0 1.0 0.0 2.0 2.6 0.6 4.0 1.0 0.0 1.0 0.0 滑刃属Aphelenchoides 2 1.8 1.7 2.9 3.2 2.3 4.3 0.6 2.1 1.8 7.0 2.5 3.9 真滑刃属Aphelenchus 2 4.0 12.4 3.1 10.4 3.0 5.1 3.4 3.3 2.3 3.1 1.9 3.8 拟矛线属Dorylaimoides 4 0.2 0.0 0.0 0.0 0.0 0.0 2.5 0.5 1.2 0.0 5.2 0.0 短矛属Doryllium 4 0.5 0.0 4.5 0.0 6.0 0.0 4.8 0.5 2.9 0.0 0.0 4.0 植食性线虫 (有害线虫) Herbivore (harmful nematodes) 异球属Stictylus 2 0.0 0.0 0.0 0.0 0.6 0.0 0.6 0.0 0.8 0.0 1.1 0.0 针属Paratylenchus 2 3.5 0.7 3.3 0.0 1.6 0.0 0.0 0.0 2.4 0.0 0.6 0.0 垫刃属Tylenchus 2 4.3 9.8 1.2 0.0 3.2 1.0 0.8 5.6 2.7 2.1 2.2 1.3 裸矛属Psilenchus 3 5.6 3.2 7.1 11.1 5.8 9.9 8.9 5.4 4.5 7.6 5.9 8.3 短体属Pratylenchus 3 1.3 0.3 2.0 0.9 2.2 4.5 2.3 3.0 0.8 0.4 2.8 0.0 矮化属Tylenchorhynchus 3 4.1 5.9 3.7 5.3 3.6 1.9 0.4 3.3 4.6 6.3 2.7 2.7 头垫刃属Tetylenchus 3 0.6 0.0 1.6 0.0 1.8 0.0 4.8 0.0 2.2 0.6 1.9 4.7 捕食/杂食性线虫 (有益线虫) Omnivore-predator (beneficial nematodes) 锉齿属Mylonchulus 4 1.1 0.0 1.0 0.0 0.6 0.0 0.4 0.2 0.0 0.0 0.4 0.0 等齿属Miconchus 4 0.8 1.4 0.4 0.6 0.4 0.4 0.6 0.2 0.8 0.0 0.4 0.6 类矛线属Amphidorylaimus 4 0.6 0.0 0.0 0.0 0.6 0.0 0.6 0.0 0.0 0.0 0.6 0.6 矛线属Dorylaimus 5 0.0 0.0 0.0 0.0 0.0 0.6 0.0 0.4 0.6 0.4 0.0 0.0 孔咽属Aporcelaimus 5 0.0 0.0 0.4 0.0 0.6 0.0 0.6 0.0 0.6 0.9 0.9 0.0 扁腔属Sectonema 5 0.0 0.0 0.8 0.9 0.8 0.8 0.6 0.2 0.6 0.6 0.7 0.9 颚针属Belondira 5 0.0 0.0 0.0 0.0 0.0 0.0 0.0 0.5 0.6 0.0 0.0 0.0 注(Note):c-p—生活史对策 Colonizer-persister; 相对丰度 > 10% 为优势属, 1% ≤ 相对丰度 ≤ 10% 为常见属, 相对丰度 < 1% 为稀有属Relative abundance > 10% means dominants; 1% ≤ relative abundance ≤ 10% means ordinary; relative abundance < 1% means rare.
下载: 导出CSV
表 4 不同施肥模式土壤消毒1年后不同土层线虫生态指数
Table 4 The ecological indices of nematode community in different layers under different fertilization patterns after 1 year of soil disinfection
项目
Item4/4CN 3/4CN + 1/4MN 2/4CN + 2/4MN 1/4CN + 3/4MN 2/4CN + 1/4MN + 1/4SN 2/4CN + 2/4SN 0—5 cm 5—10 cm 0—5 cm 5—10 cm 0—5 cm 5—10 cm 0—5 cm 5—10 cm 0—5 cm 5—10 cm 0—5 cm 5—10 cm H′ 1.09 ± 0.00 c 1.00 ± 0.01 d 1.15 ± 0.03 ab 1.01 ± 0.01 cd 1.17 ± 0.02 a 1.08 ± 0.01 b 1.19 ± 0.01 a 1.11 ± 0.01 a 1.18 ± 0.03 a 1.03 ± 0.03 c 1.13 ± 0.00 bc 1.10 ± 0.01 ab λ 0.88 ± 0.01 d 0.88 ± 0.00 c 0.90 ± 0.01 bcd 0.89 ± 0.00 c 0.90 ± 0.01 abc 0.90 ± 0.00 b 0.92 ± 0.00 a 0.91 ± 0.00 ab 0.91 ± 0.01 ab 0.89 ± 0.01 c 0.88 ± 0.00 cd 0.91 ± 0.00 a MI 1.74 ± 0.02 b 1.74 ± 0.02 a 1.80 ± 0.01 a 1.77 ± 0.03 ab 1.81 ± 0.04 a 1.76 ± 0.03 ab 1.81 ± 0.00 a 1.75 ± 0.03 b 1.82 ± 0.03 a 1.77 ± 0.02 ab 1.80 ± 0.01 a 1.80 ± 0.01 a PPI 2.31 ± 0.08 a 2.31 ± 0.04 a 2.39 ± 0.06 a 2.36 ± 0.11 a 2.41 ± 0.12 a 2.37 ± 0.07 a 2.42 ± 0.02 a 2.37 ± 0.03 a 2.42 ± 0.18 a 2.43 ± 0.23 a 2.43 ± 0.02 a 2.44 ± 0.09 a WI 4.05 ± 0.27 c 3.99 ± 0.10 b 4.12 ± 0.03 bc 4.68 ± 0.15 a 4.20 ± 0.14 bc 4.70 ± 0.15 a 4.48 ± 0.31 ab 4.71 ± 0.14 a 4.41 ± 0.08 abc 4.81 ± 0.12 a 4.65 ± 0.22 a 4.75 ± 0.12 a EI 67.6 ± 1.6 c 63.9 ± 2.0 a 68.9 ± 2.9 bc 64.1 ± 2.5 a 69.7 ± 1.9 bc 64.3 ± 1.7 a 71.9 ± 1.1 ab 65.9 ± 1.6 a 69.9 ± 0.8 bc 65.3 ± 1.8 a 73.3 ± 0.3 a 65.2 ± 1.0 a CI 12.3 ± 1.1 a 14.0 ± 1.4 a 8.8 ± 1.7 b 13.6 ± 0.7 a 7.3 ± 0.6 b 12.5 ± 0.4 a 4.9 ± 0.5 c 10.1 ± 0.9 b 8.9 ± 1.3 b 12.1 ± 1.1 a 7.4 ± 0.3 b 9.5 ± 1.4 b SI 19.2 ± 1.9 c 9.2 ± 4.9 c 38.9 ± 7.6 b 12.3 ± 3.0 bc 44.6 ± 2.2 ab 13.0 ± 1.0 bc 48.6 ± 0.2 a 17.3 ± 2.0 b 39.8 ± 3.0 b 16.0 ± 1.8 bc 44.5 ± 0.7 ab 32.4 ± 7.4 a 注(Note):H′—香农多样性指数 Shannon-weaver index; λ—优势度指数 Simpson index; MI—自由生活线虫成熟度指数 Maturity index; PPI—植食性线虫成熟度指数 Plant-parasitic index; WI—瓦斯乐斯卡指数 Wasilewska index; EI—富集指数 Enrichment index; CI—通道指数 Channel index; SI—结构指数 Structural index; 同行数据后不同小写字母表示处理间差异显著 (P < 0.05) Values followed by different letters in a row indicate significant difference among treatments (P < 0.05).
下载: 导出CSV
-
[1] 黄绍文, 唐继伟, 李春花, 等. 我国蔬菜化肥减施潜力与科学施用对策[J]. 植物营养与肥料学报, 2017, 23(6): 1480–1493. DOI: 10.11674/zwyf.17366 Huang S W, Tang J W, Li C H etal. Reducing potential of chemical fertilizers and scientific fertilization countermeasure in vegetable production in China[J]. Journal of Plant Nutrition and Fertilizers, 2017, 23(6): 1480–1493. DOI: 10.11674/zwyf.17366
[2] 杨永. 乡村振兴下的蔬菜产业绿色发展研究[J]. 江苏农业科学, 2019, 47(9): 11–15. Yang Y. Study on green development of vegetable industry under rural vitalization strategy[J]. Jiangsu Agricultural Sciences, 2019, 47(9): 11–15.
[3] 王欢. 我国蔬菜生产效率及其时空效应研究[D]. 北京: 中国农业大学博士学位论文, 2018. Wang H. The research on vegetable production efficiency and its time and space effect in China[D]. Beijing: PhD Dissertation of China Agricultural University, 2018.
[4] 张福建. 江西省设施辣椒连作障碍现状调查及缓解技术的研究[D]. 南昌: 江西农业大学硕士学位论文, 2018. Zhang F J. Investigation on the current situation of continuous cropping obstacle and study on the mitigation technology of facility pepper in Jiangxi Province[D]. Nanchang: MS Thesis of Jiangxi Agricultural University, 2018.
[5] 王孝忠. 我国蔬菜生产的环境代价、减排潜力与调控途径[D]. 北京: 中国农业大学博士学位论文, 2018. Wang X Z. Environmental impacts, mitigation potentials and management approaches in Chinese vegetable production system–pepper as a case[D]. Beijing: PhD Dissertation of China Agricultural University, 2018
[6] 李燕青. 不同类型有机肥与化肥配施的农学和环境效应研究[D]. 北京: 中国农业科学院博士学位论文, 2016. Li Y Q. Study on agronomic and environmental effects of combined application of different organic manures with chemical fertilizer[D]. Beijing: PhD Dissertation of Chinese Academy of Agricultural Sciences, 2016.
[7] 李瑞. 化肥减施对设施蔬菜土壤性质及关键污染因子的影响[D]. 哈尔滨: 东北农业大学硕士学位论文, 2019. Li R. Effects of chemical fertilizer reduction on soil properties and key pollution factors of facility vegetables[D]. Harbin: MS Thesis of Northeast Agricultural University, 2019.
[8] 黄鸿翔, 李书田, 李向林, 等. 我国有机肥的现状与发展前景分析[J]. 土壤肥料, 2006, (1): 3–8. Huang H X, Li S T, Li X L, et al. Analysis of the status and development prospects of organic fertilizer in China[J]. Soil and Fertilizer Sciences in China, 2006(01): 3–8.
[9] 毕于运. 秸秆资源评价与利用研究[D]. 北京: 中国农业科学院博士学位论文, 2010. Bi Y Y. Study on straw resources evaluation and utilization in China[D]. Beijing: PhD Dissertation of Chinese Academy of Agricultural Sciences, 2010.
[10] 黄绍文, 王玉军, 金继运, 等. 我国主要菜区土壤盐分、酸碱性和肥力状况[J]. 植物营养与肥料学报, 2011, 17(4): 906–918. DOI: 10.11674/zwyf.2011.1104 Hang S W, Wang Y J, Jin J Y et al. Status of salinity, pH and nutrients in soils in main vegetable production regions in China[J]. Journal of Plant Nutrition and Fertilizer Science, 2011, 17(4): 906–918. DOI: 10.11674/zwyf.2011.1104
[11] Kladivko E J. Tillage systems and soil ecology[J]. Soil &Tillage Research, 2001, 61(1).
[12] 张志丹, 董炜华, 魏健, 等. 土壤动物学研究进展[J]. 中国农学通报, 2012, 28(29): 242–246. DOI: 10.3969/j.issn.1000-6850.2012.29.049 Zhang Z D, Dong W H, Wei J et al. Research progresses of soil fauna[J]. Chinese Agricultural Science Bulletin, 2012, 28(29): 242–246. DOI: 10.3969/j.issn.1000-6850.2012.29.049
[13] 邵元虎, 张卫信, 刘胜杰, 等. 土壤动物多样性及其生态功能[J]. 生态学报, 2015, 35(20): 6614–6625. Shao Y H, Zhang W X, Liu S J et al. Diversity and function of soil fauna[J]. Acta Ecologica Sinica, 2015, 35(20): 6614–6625.
[14] 曹四平, 刘长海. 土壤动物群落特征及生态功能研究进展[J]. 延安大学学报(自然科学版), 2017, 36(4): 38–42. Cao S P, Liu C H. Research progresses ecological characteristics and functions of soil fauna community[J]. Journal of YananUniversity(Natural Science Edition), 2017, 36(4): 38–42.
[15] 张雪萍. 土壤动物与环境质量关系探讨[J]. 哈尔滨师范大学自然科学学报, 1995, (4): 95–99. Zhang X P. Discussion on the relationship between soil animals and environmental quality[J]. Natural Science Journal of Harbin Normal University, 1995, (4): 95–99.
[16] Yeates T, Bongers. Nematode diversity in agroecosystems[J]. Agriculture, Ecosystems and Environment, 1999, 74(1–3): 113–135. DOI: 10.1016/S0167-8809(99)00033-X
[17] 梁文举, 闻大中. 土壤生物及其对土壤生态学发展的影响[J]. 应用生态学报, 2001, (1): 137–140. DOI: 10.3321/j.issn:1001-9332.2001.01.032 Liang W J, Wen D Z. Soil biota and its role in soil ecology[J]. Chinese Journal of Applied Ecology, 2001, (1): 137–140. DOI: 10.3321/j.issn:1001-9332.2001.01.032
[18] 蒋海东, 杨青, 吕宪国. 土壤动物在农业生态系统中的研究进展[J]. 土壤通报, 2006, (4): 805–808. DOI: 10.3321/j.issn:0564-3945.2006.04.041 Jiang H D, Yang Q, Lv X G. Advance of study on soil fauna in agricultural ecosystem[J]. Chinese Journal of Soil Science, 2006, (4): 805–808. DOI: 10.3321/j.issn:0564-3945.2006.04.041
[19] Liang W J, Lou Y L, Li Q et al. Nematode faunal response to long-term application of nitrogen fertilizer and organic manure in Northeast China[J]. Soil Biology and Biochemistry, 2008, 41(5): 883-890
[20] 宋理洪, 武海涛, 吴东辉. 我国农田生态系统土壤动物生态学研究进展[J]. 生态学杂志, 2011, 30(12): 2898–2906. Song L H, Wu H T, Wu D H. Soil fauna ecology in China cropland ecosystems: Research progress[J]. Chinese Journal of Ecology, 2011, 30(12): 2898–2906.
[21] Ugarte C M, Zaborski E R, Wander M M. Nematode indicators as integrative measures of soil condition in organic cropping systems[J]. Soil Biology and Biochemistry, 2013, 64: 103–113 DOI: 10.1016/j.soilbio.2013.03.035
[22] 李玉娟, 吴纪华, 陈慧丽, 等. 线虫作为土壤健康指示生物的方法及应用[J]. 应用生态学报, 2005, (8): 1541–1546. DOI: 10.3321/j.issn:1001-9332.2005.08.031 Li Y J, Wu J H, Chen H L et al. Nematodes as bioindicator of soil health: methods and applications[J]. Chinese Journal of Applied Ecology, 2005, (8): 1541–1546. DOI: 10.3321/j.issn:1001-9332.2005.08.031
[23] 张晓珂, 梁文举, 李琪. 我国土壤线虫生态学研究进展和展望[J]. 生物多样性, 2018, 26(10): 1060–1073. DOI: 10.17520/biods.2018082 Zhang X K, Liang W J, Li Q. Recent progress and future directions of soil nematode ecology in China[J]. Biodiversity Science, 2018, 26(10): 1060–1073. DOI: 10.17520/biods.2018082
[24] 朱震, 陈芳, 肖同建, 等. 拮抗菌生物有机肥对番茄根结线虫的防治作用[J]. 应用生态学报, 2011, 22(4): 1033–1038. Zhu Z, Chen F, Xiao T J et al. Controlling effect of antagonist bioorganic fertilizer on tomato root-knot nematode[J]. Chinese Journal of Applied Ecology, 2011, 22(4): 1033–1038.
[25] 陈秀菊, 坚晋卓, 李惠霞, 等. 2株真菌种类鉴定及对禾谷孢囊线虫的防治效果[J]. 华南农业大学学报, 2020, (1): 1–8. DOI: 10.7671/j.issn.1001-411X.201910031 Chen X J, Jian J Z, Li H X et al. Species identification and control effects of two fungi to cereal cyst nematode[J]. Journal of South China Agricultural University, 2020, (1): 1–8. DOI: 10.7671/j.issn.1001-411X.201910031
[26] 林英华, 杨学云, 张夫道, 等. 长期施肥对黄土区农田土壤动物群落的影响[J]. 中国农业科学, 2005, (6): 1213–1218. DOI: 10.3321/j.issn:0578-1752.2005.06.021 Lin Y H, Yang X Y, Zhang F D et al. Effect of long-term fertilization on cropland soil fauna community in loess soil, Shaanxi, China[J]. Scientia Agricultura Sinica, 2005, (6): 1213–1218. DOI: 10.3321/j.issn:0578-1752.2005.06.021
[27] 战丽莉, 许艳丽, 韩晓增. 长期施肥对东北黑土玉米田土壤动物影响[J]. 土壤与作物, 2012, 1(2): 94–99. Zhan L L, Xu Y L, Han X Z. Effect of long-term fertilization on soil fauna diversity in the farmland of black soil in northeast China[J]. Soil and Crop, 2012, 1(02): 94–99.
[28] 梁文举, 姜勇, 李琪, 等. 施用化肥对下辽河平原稻田土壤线虫群落产生的影响[J]. 土壤通报, 2004, (6): 773–775. DOI: 10.3321/j.issn:0564-3945.2004.06.022 Liang W J, Jiang Y, Li Q et al. Effect of chemical fertilizers on paddy soil nematode communities in the lower reaches of Liaohe Plain[J]. Chinese Journal of Soil Science, 2004, (6): 773–775. DOI: 10.3321/j.issn:0564-3945.2004.06.022
[29] 刘婷, 叶成龙, 陈小云, 等. 不同有机肥源及其与化肥配施对稻田土壤线虫群落结构的影响[J]. 应用生态学报, 2013, 24(12): 3508–3516. Liu T, Ye C L, Chen X Y et al. Effects of different organic manure sources and their combinations with chemical fertilization on soil nematode community structure in a paddy field of East China[J]. Chinese Journal of Applied Ecology, 2013, 24(12): 3508–3516.
[30] 熊伟东. 有机物料部分替代化肥氮对土壤生物学肥力指标和小麦产量的影响[D]. 郑州: 河南农业大学硕士学位论文, 2017. Xiong W D. Effect of substance of organic material pratical substituting to fertilizer nitrogen on soil biological fertility[D]. Zhengzhou: MS Thesis of Henan Agricultural University, 2017.
[31] 刘婷, 叶成龙, 李勇, 等. 不同有机类肥料对小麦和水稻根际土壤线虫的影响[J]. 生态学报, 2015, 35(19): 6259–6268. Liu T, Ye C L, Li Y, et al. Effects of different organic fertilizers on soil nematodes in the rhizosphere of rice and wheat cropland[J]. Acta EcologicaSinica, 2015, 35(19): 6259–6268.
[32] 殷秀琴, 马祝阳. Tullgren法对土壤动物的分离效率[J]. 东北师大学报(自然科学版), 2002, (2): 84–91. DOI: 10.3321/j.issn:1000-1832.2002.02.017 Yin X Q, Ma Z Y. Segregate efficiency of Tullgren method to middle–small–sized soil animal[J]. Journal of Northeast Normal University(Natural Science Edition), 2002, (2): 84–91. DOI: 10.3321/j.issn:1000-1832.2002.02.017
[33] 朱新玉, 朱波. 不同施肥方式对紫色土农田土壤动物主要类群的影响[J]. 中国农业科学, 2015, 48(5): 911–920. DOI: 10.3864/j.issn.0578-1752.2015.05.09 Zhu X Y, Zhu B. Effect of different fertilization regimes on the main groupsof soil fauna in cropland of purple soil[J]. Scientia Agricultura Sinica, 2015, 48(5): 911–920. DOI: 10.3864/j.issn.0578-1752.2015.05.09
[34] 戚琳, 韩承辉, 宋修超, 等. 线虫对土壤重金属污染的生物指示作用研究进展[J]. 绿色科技, 2017, (12): 12–14, 19. Qi L, Han C H, Song X C et al. Advances in biological instructions of nematode on soil heavy metal pollution[J]. Journal of Green Science and Technology, 2017(12): 12–14, 19.
[35] 张航, 栾小兵, 刘奇志. 土壤线虫群落对梨园不同害虫防治策略的响应[J]. 生态与农村环境学报, 2019, 35(8): 1043–1050. Zhang H, Luan X B, Liu Q Z. Response of soil nematodes to different pest control strategies in the pear orchard[J]. Chinese Journal of Applied Ecology, 2019, 35(8): 1043–1050.
[36] Bongers T. The maturity index: An ecological measure of environmental disturbance based on nematode species composition[J]. Oecologia, 1990, 83(1): 14–19. DOI: 10.1007/BF00324627
[37] Yeates G W. Modification and qualification of the nematode maturity index[J]. Pedobiologia, 1994, 38(2): 97–101.
[38] Yeates G W. Variation in soil nematode diversity under pasture with soil and year[J]. Soil Biology & Biochemistry, 1984, 16(2): 95–102.
[39] Bongers T, Bongers M. Functional diversity of nematodes[J]. Applied Soil Ecology, 1998, 10(3): 239–251. DOI: 10.1016/S0929-1393(98)00123-1
[40] 李琪, 梁文举, 姜勇. 农田土壤线虫多样性研究现状及展望[J]. 生物多样性, 2007, (2): 134–141. DOI: 10.3321/j.issn:1005-0094.2007.02.004 Li Q, Liang W J, Jiang Y. Present situation and prospect of soil nematode diversity in farmland ecosystems[J]. Biodiversity Science, 2007, (2): 134–141. DOI: 10.3321/j.issn:1005-0094.2007.02.004
[41] 陈云峰, 韩雪梅, 李钰飞, 等. 线虫区系分析指示土壤食物网结构和功能研究进展[J]. 生态学报, 2014, 34(5): 1072–1084. Chen Y F, Han X M, Li Y F et al. Approach of nematode fauna analysis indicate the structure and function of soil food web[J]. Acta Ecologica Sinica, 2014, 34(5): 1072–1084.
[42] 费冲. 棕壤田土壤线虫多样性及对长期定位施肥的响应研究[D]. 沈阳: 沈阳农业大学硕士学位论文, 2016. Fei C. Bio–diversity and responses of soil nematodes in long–term fertilization in brown soil area[D]. Shenyang: MS Thesis of Shenyang Agricultural University, 2016.
[43] 胡宁. 广西喀斯特人工林生态恢复土壤微食物网演变特征及机制[D]. 哈尔滨: 东北大学博士学位论文, 2016. Hu N. Soil micro–food web evolution characteristic and mechanism following Karst ecosystem restoration by forestation in Guangxi region[D]. Harbin: PhD Dissertation of Northeastern University, 2016.
[44] 王邵军, 蔡秋锦, 阮宏华. 不同生境柳杉根际线虫群落的生态特征[J]. 生态学杂志, 2008, (4): 583–590. Wang S J, Cai Q J, Ruan H H. Ecological characteristics of nematode communities in rhizosphere soil at different habitats of Crytomeriafortunei[J]. Chinese Journal of Ecology, 2008, (4): 583–590.
[45] 林英华, 张夫道, 杨学云, 等.. 农田土壤动物与土壤理化性质关系的研究[J]. 中国农业科学, 2004, (6): 871–877. DOI: 10.3321/j.issn:0578-1752.2004.06.015 Lin Y H, Zhang F D, Yang X Y et al. Study on the relationship between agricultural soil fauna and soil physicochemical properties[J]. Scientia Agricultura Sinica, 2004, (6): 871–877. DOI: 10.3321/j.issn:0578-1752.2004.06.015
[46] 韩鲁佳, 闫巧娟, 刘向阳, 等. 中国农作物秸秆资源及其利用现状[J]. 农业工程学报, 2002, (3): 87–91. DOI: 10.3321/j.issn:1002-6819.2002.03.022 Han L J, Yan Q J, Liu X Y et al. Straw resources and their utilization in China[J]. Transactions of the Chinese Society of Agricultural Engineering, 2002, (3): 87–91. DOI: 10.3321/j.issn:1002-6819.2002.03.022
[47] 朱健来, 王开诚, 刘洋. 不同肥料对土壤动物的影响[J]. 生物学通报, 2006, (3): 59–60. DOI: 10.3969/j.issn.0006-3193.2006.03.029 Zhu J L, Wang K C, Liu Y. Effects of different fertilizers on soil animals[J]. Bulletin of Biology, 2006, (3): 59–60. DOI: 10.3969/j.issn.0006-3193.2006.03.029
[48] 朱新玉, 董志新, 况福虹, 等. 长期施肥对紫色土农田土壤动物群落的影响[J]. 生态学报, 2013, 33(2): 464–474. Zhu X Y, Dong Z X, Kuang F H, et al. Effects of fertilization regimes on soil faunal communities in cropland of purple soil, China[J]. Acta EcologicaSinica, 2013, 33(2): 464–474.
[49] 陈云峰, 夏贤格, 胡诚, 等. 有机肥和秸秆还田对黄泥田土壤微食物网的影响[J]. 农业工程学报, 2018, 34(S1): 19–26. Chen Y F, Xia X G, Hu C et al. Effects of manure fertilizer application and straw return on micro-food web of yellow field soil[J]. Transactions of the Chinese Society of Agricultural Engineering, 2018, 34(S1): 19–26.
[50] 李淑梅, 樊淑华. 施用不同肥料对农田土壤动物群落结构的影响[J]. 河南农业科学, 2008, (2): 57–59. DOI: 10.3969/j.issn.1004-3268.2008.02.016 Li S M, Fan S H. Effects of applying different fertilizers on soil animal community structure[J]. Journal of Henan Agricultural Sciences, 2008, (2): 57–59. DOI: 10.3969/j.issn.1004-3268.2008.02.016
[51] 王学霞, 陈延华, 王甲辰, 等. 设施菜地种植年限对土壤理化性质和生物学特征的影响[J]. 植物营养与肥料学报, 2018, 24(6): 1619–1629. DOI: 10.11674/zwyf.18253 Wang X X, Chen Y H, Wang J C et al. Effects of vegetable planting ages on the physical and chemical and biological properties of greenhouse soils in Beijing[J]. Journal of Plant Nutrition and Fertilizers, 2018, 24(6): 1619–1629. DOI: 10.11674/zwyf.18253
[52] 李季, 彭生平. 堆肥工程实用手册[M]. 北京: 化学工业出版社, 2011. Li J, Peng S P. Practical handbook of compost engineering[M]. Beijing: Chemical Industry Press, 2011.
[53] 林琳, 王琳, 张雪萍, 等. 不同施肥处理方式下土壤线虫群落结构的研究[J]. 国土与自然资源研究, 2013, (3): 90–92. DOI: 10.3969/j.issn.1003-7853.2013.03.036 Lin L, Wang L, Zhang X P et al. Study on soil nematode community structure under different fertilization treatment conditions[J]. Territory & Natural Resources Study, 2013, (3): 90–92. DOI: 10.3969/j.issn.1003-7853.2013.03.036
[54] Wallenstein M D, McNulty S, Fernandez I J, et al. Nitrogen fertilization decreases forest soil fungal and bacterial biomass in three long-term experiments[J]. Forest Ecology and Management, 2005, 222(1–3): 459–468.
[55] 王慧, 桂娟, 刘满强, 等. 稻草和三叶草分解对微型土壤动物群落的影响[J]. 土壤学报, 2015, 52(5): 1124–1134. Wang H, Gui J, Liu M Q, et al. Effect of clover and straw decomposition on mircofaunal community[J]. Acta Pedologica Sinica, 2015, 52(5): 1124–1134.
[56] Zhang Z Y, Zhang X K, Xu M G, et al. Responses of soil micro-food web to long-term fertilization in a wheat–maize rotation system[J]. Applied Soil Ecology, 2016, 98: 56–64. DOI: 10.1016/j.apsoil.2015.09.008
[57] Treonis A M, Austin E E, Buyer J S, et al. Effects of organic amendment and tillage on soil microorganisms and microfaunal[J]. Applied Soil Ecology, 2010, 46(1): 104–110.
[58] 叶成龙, 刘婷, 张运龙, 等. 麦地土壤线虫群落结构对有机肥和秸秆还田的响应[J]. 土壤学报, 2013, 50(5): 997–1005. Ye C L, Liu T, Zhang Y L, et al. Response of soil nematode community to application of organic manure and incorporation of straw in wheat filed[J]. Acta Pedologica Sinica, 2013, 50(5): 997–1005.
[59] 刘婷. 施肥对稻麦轮作体系中土壤线虫群落结构的影响及调控机制[D]. 南京: 南京农业大学博士学位论文, 2016. Liu T. The pattern and mechanism of fertilization effect on soil nematode community in a paddy rice–upland wheat agroecosystem[D]. Nanjing: PhD Dissertation of Nanjing Agriculture University, 2016.
[60] 孔云. 施肥措施和秸秆还田对潮土农田土壤动物的影响[D]. 沈阳: 沈阳农业大学硕士学位论文, 2018. Kong Y. Effect of fertilization regime and straw returning on soil fauna in the fluvo-aquic soil[D]. Shenyang: MS Thesis of Shenyang Agricultural University, 2018.
[61] 王文锋, 李春花, 黄绍文, 等. 不同施肥模式对设施菜田土壤微生物量碳、氮的影响[J]. 植物营养与肥料学报, 2016, 22(5): 1286–1297. DOI: 10.11674/zwyf.15057 Wang W F, Li C H, Huang S W, et al. Effects of different fertilization patterns on microbial biomass carbon and nitrogen in greenhouse vegetable soil[J]. Journal of Plant Nutrition and Fertilizers, 2016, 22(5): 1286–1297. DOI: 10.11674/zwyf.15057
-
期刊类型引用(9)
1. 齐俊,余夏薇,黄静,张坤,张鑫,郭肖颖,胡淑恒. 不同比例猪粪沼液配施对小麦土壤线虫群落结构的影响. 江苏农业科学. 2024(02): 228-234 .  百度学术
百度学术
2. 包玲凤,苏银玲,李孝梅,张达,木万福,杨子祥. 施肥对土壤线虫群落特征和根结线虫病的影响. 植物保护. 2024(06): 93-105+199 . 百度学术
3. 冯磊,李妍,梁学强,李琳,李航,李锦. 蔬菜秸秆废弃物资源化利用现状. 农业工程. 2023(11): 58-62 . 百度学术
4. 胡岚,梁波,陈云峰,李钰飞,张玉峰,郑春燕,伍玉鹏. 长期施用不同肥料对橘园土壤生物群落结构的影响. 农业资源与环境学报. 2022(01): 80-87 . 百度学术
5. 万进,张新潮,夏清强,陈彪彪,潘继承. 复配益生菌对秸秆发酵中总糖含量和活菌数影响的研究. 湖北师范大学学报(自然科学版). 2022(01): 32-37 . 百度学术
6. 耿文敬,曹森,樊琼,张鑫,齐俊,王晓飞,朱江,郭肖颖. 利用土壤线虫生态指标表征砂姜黑土土壤健康状况的探讨. 中国农业大学学报. 2021(12): 180-192 . 百度学术
7. 曾猛,潘玉蕊,彭银,达布希拉图. 减量化肥配合炭基有机肥对设施切花月季生长及土壤性状的影响. 南方农业学报. 2021(08): 2202-2210 . 百度学术
8. 李其胜,张顺涛,赵贺,高飞,焦加国,胡锋,李辉信,鲁剑巍. 化肥减量配施有机物料对油菜地土壤线虫群落结构的影响. 生态学杂志. 2021(12): 3970-3981 . 百度学术
9. 马嘉昱,马越,杨贝贝,赵一,申志博,李典鹏,贾宏涛,朱新萍. 柴窝堡湖湿地不同土地利用方式对土壤线虫群落的影响. 新疆农业大学学报. 2021(05): 313-323 . 百度学术
其他类型引用(10)
计量
- 文章访问数: 2131
- HTML全文浏览量: 1225
- PDF下载量: 89
- 被引次数: 19
