
Yield effect change of fertilizers in the past 14 years and optimized fertilization of winter wheat in north of China
-
摘要:目的
通过分析近14年来北方冬小麦肥料产量效应的多点试验数据,明确北方冬小麦产量变化特征及肥料产量效应,为该区冬小麦养分管理和合理施肥提供科学依据。
方法通过我国北方冬小麦区2002—2016年96个定位监测试验,研究小麦地力产量和肥料农学效率变化趋势;通过120个田间肥料效应的检验试验,研究不同时段和不同施肥水平时氮、磷、钾在冬小麦上的产量效应;以肥料农学效率变化和施肥产量效应为依据,通过24个田间试验对习惯施用的复合肥配方进行田间校验,提出相应的节肥增效建议。
结果1) 2002—2016年间,北方冬小麦区的土壤供肥能力呈逐渐增加的趋势,其平均地力产量自2002年的4721 kg/hm2增加到2016年的5828 kg/hm2,年均增加1.6%。施肥能显著增加小麦产量,但施肥增产率从2005年后呈下降趋势,由2005年的30.9%下降至2016年的20.2%。2) 2002—2016年,肥料的农学效率呈下降趋势,由2002年的9.0 kg/kg下降至2010年的6.7 kg/kg,2010年后维持在6.3~6.7 kg/kg。3) 基于不同时段氮、磷、钾在冬小麦上的产量效应函数计算出经济施肥量,其中2002—2006年间,最高产量的N、P2O5、K2O施用量分别为180.5、107.4、55.9 kg/hm2;经济最佳用量分别为167.8、102.5、53.7 kg/hm2;经济合理用量 (R = 0.1) 分别为155.5、99.9、52.8 kg/hm2;2012—2016年间,最高产量的N、P2O5、K2O施用量分别为184.3、125.1、52.4 kg/hm2;经济最佳用量分别为171.7、118.5、48.6 kg/hm2;经济合理用量分别为159.2、114.9、47.0 kg/hm2;优化复合肥N–P2O5–K2O配方为16–20–8,比常规原配方减少氮磷钾总用量的12.0%。
结论从2002年到2016年,北方冬小麦区土壤地力产量逐渐提高,虽然施肥仍有显著增产效果,但增产率和农学效率呈逐渐降低的趋势,2016年施肥增产率为20.2%,肥料农学效率维持在6.5 kg/kg。北方冬小麦N–P2O5–K2O优化配方为16–20–8,推荐施肥方案为:基肥该配方肥600 kg/hm2,追施氮69 kg/hm2。
Abstract:ObjectivesClarifying the winter wheat yield change and the effect of fertilization will set up a fundamental basis for scientific nutrient management in the winter wheat production in north of China.
MethodsNinety-six localized field experiments were carried out, in which the treatments were all composed of no fertilizer control and conventional fertilizer rate, and the yield effect and agronomic efficiency of N, P and K fertilizers of winter wheat were investigated. The fertilizer optimization experiments were carried out in 120 sites, using local winter wheat cultivars and fertilizers as tested materials. The experiment used split plot design, with the main factor of different levels of N, P and K, and the secondary factor was high, middle and low levels of the other two nutrients. The yield effects of N, P and K were calculated, and the recommended rates were proposed.
ResultsFrom 2002 to 2016, the supply capacity of soil nutrients were kept increasing. The average soil fertility yield increased from 4721 kg/hm2 in 2002 to 5828 kg/hm2 in 2016, with an average annual increase of 1.6%. Application of N P K fertilizers significantly increased wheat yield, however, the yield increase rate became lower with diminishing returns (quadratic equation of one variable), the growth rate decreased from 30.9% in 2005 to 20.2% in 2016. The agronomic efficiency of NPK decreased from 9.0 kg/kg in 2002 to 6.7 kg/kg in 2010, and remained at 6.3–6.7 kg/kg after 2010. Based on the yield effect function of N, P and K in different periods, the calculated average N, P2O5 and K2O rates for maximum yield were 180.5 kg/hm2, 107.4 kg/hm2 and 55.9 kg/hm2, and for the economic yield were 167.8 kg/hm2, 102.5 kg/hm2 and 53.7 kg/hm2, and for the reasonable yield were 155.5 kg/hm2, 99.9 kg/hm2 and 52.8 kg/hm2, and the optimized formula was 18–18–8 in 2002–2006. The average rates of N, P2O5 and K2O for the maximum yield in 2012–2016 were 184.3 kg/hm2, 125.1 kg/hm2, 52.4 kg/hm2, for economic optimal yield were 171.7 kg/hm2, 118.5 kg/hm2 and 48.6 kg/hm2, and for the reasonable yield were 159.2 kg/hm2, 114.9 kg/hm2 and 47.0 kg/hm2, and the optimized formula in 2016 was 16–20–8, the total nutrient input was reduced by 12%, compared with the original formula.
ConclusionsFrom 2002 to 2016, the supply capacity of soil nutrients is kept improving in the main winter wheat yield areas in north of China. The yield increase rate and the agronomic efficiency are decreased, in spite of the significant yield effects. The averaged fertilizer yield increase rate is about 20.2%, and the agronomy efficiency is maintained at 6.5 kg/kg in 2016. The proposed regional compound fertilizer formula of winter wheat is 16–20–8, the recommended total base NPK fertilizer nutrient rate is 600 kg/hm2, and top-dressing rate is N 69 kg/hm2.
-
Keywords:
- winter wheat /
- NPK fertilizer /
- yield effect /
- agronomic efficiency /
- formula optimization
-
冬小麦是北方地区 (河北、河南、安徽、山东) 主要的粮食作物。据统计,2018年该地区冬小麦种植面积为1503.1 × 104 hm2,产量为9132.8 × 104 t,分别占全国小麦总种植面积和总产量的61.9%和69.4%[1]。近年来,农业生产中过量施肥现象比较普遍,约占种植面积的75%[2],这也是小麦生产中的一个重要问题。有研究表明,北方冬小麦肥料用量远高于需肥量[3-4],农民习惯的氮、磷肥投入量分别是消耗量的2.6倍和4.1倍[5]。长期过量施肥增加了土壤养分含量和供肥能力,与第二次土壤普查相比,土壤有机质、全氮、有效磷含量分别增加了2.61~6.10 g/kg、0.12~0.23 g/kg、7.89~20.68 mg/kg,1996—1999年冬小麦茬口土壤供氮、磷、钾能力分别增加了37.9%、0.7%、2.1%[6],土壤氮、磷、钾实际平衡盈余分别高达81.1%、88.5%和11.9%[7]。已有基于小区试验或统计数据的土壤养分状况的分析报道[3-5],而没有基于整个北方冬小麦生产区进行多年多点田间研究试验,尤其缺乏基于北方地区冬小麦土壤实际供肥能力、地力产量和肥料农学效率变化的资料。
随着土壤供肥能力和肥料农学效率的变化,肥料在作物上的产量效应也随之改变。一般认为,根据肥料效应函数计算出的最高产量施肥量及最高产量,能够反映土壤肥力的变化及肥料增产效应的变化[8-9]。有学者认为,随着土壤养分含量的增加,一元二次肥料曲线或二元二次肥料效应曲面二次项系数逐渐变大,曲线曲率变缓[10],在此基础上,提出用二次式和平台两组函数拟合肥料效应,进而计算推荐施肥量[11]。但是,这两种方法都是基于某一田块试验得出的结论,并没有进行多点田间试验验证。20世纪80年代,杨守春等[12]根据多年多点田间试验,利用肥料效应函数计算了北方地区冬小麦推荐施肥量和最高产量,并进一步分析了该地区冬小麦施肥产量效应及变化规律,与其他学者不同的是,他们采用了经济合理施肥量作为小麦施肥推荐量。
肥料效应函数可以计算出最高产量施肥量、经济最佳施肥量和经济合理施肥量。经济最佳施肥量指边际产值与边际成本相等,边际利润率等于零 (R = 0) 时的施肥量,为单位面积利润最大的施肥量。经济合理施肥量是指肥料投资利润等于最优投资利润 (R = 0.1) 的施肥量,代表单位肥料投资利润最大[8-9]。由经济最佳施肥量和经济合理施肥量的定义可知,后者更符合农民实际施肥需求。
近些年,复合肥在小麦生产中的应用比例逐年增高[13],既有根据土壤养分状况、作物需肥规律或土壤养分平衡状况确定的合理施肥量和复合肥配方[14-17],也有采用肥料效应函数计算的合理施肥量[18]。但在小麦生产中,推荐施肥配方与复合肥生产依然处于脱节状态,有必要将产量效应田间试验与复合肥配方校验试验有机结合起来,解决肥料生产和农业需求脱节的问题。为此,我们通过多年、多点田间试验,研究了氮、磷、钾肥在北方冬小麦上的产量效应和农学效率的变化趋势;又进一步研究了不同时段、不同施肥水平下氮、磷、钾肥产量响应状况,通过肥料产量效应田间校验法优化复合肥配方,为冬小麦生产的减肥增效提供科学依据。
1. 材料与方法
试验在安徽、河北、河南和山东4个北方冬小麦主产省份进行。通过96个施肥监测试验点,研究农田施肥对冬小麦产量和肥料农学效率的影响;通过120个产量效应试验点,研究不同时段和不同施肥水平时氮、磷、钾在冬小麦上的产量效应;通过24个田间试验点对小麦施肥进行优化,并提出相应节肥增效建议。
1.1 冬小麦产量和肥料农学效率监测试验
96个小麦施肥监测试验点分布为安徽省21个、河北省26个、河南省26个、山东省23个。试验分别于2002年、2005—2013年、2016年实施。所有试验均设两个处理:不施肥 (对照) 和习惯施肥,不设重复。小麦收获后分别统计两个处理的小麦平均产量并计算肥料农学效率,小麦增产率 (%) = (Y施肥 – Y对照)/Y对照 × 100,式中Y代表产量;肥料农学效率 (kg/kg) = (Y施肥 – Y对照)/养分投入总量。
1.2 氮、磷、钾施用水平对冬小麦产量的影响试验
试验点分布于安徽、河北、河南和山东4个省共计120个小麦试验点 (图1),其中安徽24个、河北35个、河南31个、山东30个。试验于2002—2006年和2012—2016年两个时间段内实施。试验点都相对均匀地分布在4个试验省份内。土壤类型主要是褐土、潮土和潮褐土。各试验点土壤基础pH及养分状况见表1。
表 1 冬小麦试验点土壤基本性状Table 1. Soil properties of experiment locations in North China年份
YearpH 有机质 Organic matter (g/kg) 有效磷 Available P (mg/kg) 速效钾 Available K (mg/kg) 范围
Range均值 ± SD
Mean ± SD范围
Range均值 ± SD
Mean ± SD范围
Range均值 ± SD
Mean ± SD范围
Range均值 ± SD
Mean ± SD2002—2006 6.50~8.31 7.52 ± 0.63 9.06~36.0 14.0 ± 6.2 6.90~46.0 27.2 ± 12.0 56.4~270 105 ± 48.0 2012—2016 6.90~8.03 7.51 ± 0.41 8.01~28.7 15.0 ± 9.3 18.0~59.0 21.8 ± 11.3 43.3~287 108 ± 48.3 试验采用裂区设计,主处理因素为氮、磷、钾肥水平,副处理为该处理主因素外的另外两个因素水平,均设低、中、高3个水平,每个试验点,3次重复。小区之间以田埂分隔,每个小区的面积为40~60 m2,试验地周围设1 m保护行。2002—2006年和2012—2016年两个时间段的试验相对独立,磷、钾肥全部作为基肥,氮肥基追比1∶0.71。各处理主、副因素及施肥水平见表2。
表 2 试验设计及各因素水平Table 2. Levels of main and secondary factors in split-plot design年份
Year主处理
Main factor主处理水平 (kg/hm2)
Main factor levels副处理
Secondary factor副处理水平 (kg/hm2)
Secondary factor levels试验点数
Experiment number2002—2006 N 105, 135, 150, 165, 180, 210, 240 低量磷钾 Low P and K P2O5 80, K2O 20 19 中量磷钾 Mid P and K P2O5 100, K2O 50 高量磷钾 High P and K P2O5 120, K2O 70 P2O5 75, 90, 105, 120, 135, 150 低量氮钾 Low N and K N 140, K2O 20 20 中量氮钾 Mid N and K N 180, K2O 50 高量氮钾 High N and K N 220, K2O 70 K2O 15, 30, 45, 60, 90 低量氮磷 Low N and P N 140, P2O5 80 21 中量氮磷 Mid N and P N 180, P2O5 100 高量氮磷 High N and P N 220, P2O5 120 2012—2016 N 150, 180, 195, 210, 225, 240 低量磷钾 Low P and K P2O5 90, K2O 20 19 中量磷钾 Mid P and K P2O5 120, K2O 50 高量磷钾 High P and K P2O5140, K2O 70 P2O5 75, 90, 105, 120, 135, 150 低量氮钾 Low N and K N 150, K2O 20 21 中量氮钾 Mid N and K N 190, K2O 50 高量氮钾 High N and K N 230, K2O 70 K2O 15, 30, 45, 60, 90 低量氮磷 Low N and P N 150, P2O5 90 20 中量氮磷 Mid N and P N 190, P2O5 120 高量氮磷 High N and P N 230, P2O5 140 试验所用肥料包括复合肥、尿素、磷酸二铵、磷酸一铵、氯化钾。各试验地点小麦种植密度采用当地水平,品种为当地主栽品种,共有18个,分别为:烟农935031、淄麦12、山农664、豫麦18、偃展4110、焦农D1、石新733、百农矮抗58、潍麦8号、石麦14、衡观35、石新828、鲁麦24号、矮抗58、冀5265、良星99、武农148、平安7号。每年秋季9月20日—10月10日期间播种,次年5月25日—6月10日期间收获。田间灌溉、除草和病虫害防治等管理措施均采用当地常规方法。
选用小区中间30 m2的小麦进行测产。所有数据用Excel 2010 整理,用SPSS 17.0 软件做方差分析,用LSD分析处理间差异显著性 (P < 0.05)。采用一元二次方程 y = ax2 + bx + c (R2)[9]分析主因素肥料水平在冬小麦上的产量效应,其中,y (kg/hm2) 代表小麦产量,x (kg/hm2) 代表主因素肥料用量,使用Excel 2010绘制二次曲线并求出方程,得出效应系数a、b、c值。
对肥料产量效应函数y = ax2 + bx + c 求导:dy/dx = Px/Py(R + 1),式中,y为小麦产量,x为主处理肥料用量,Px为小麦单价,Py为肥料单价,R为边际利润率。当R = 0时计算的施肥量为最佳经济施肥量,当R = 0.1时计算的施肥量为经济合理用量[9]。
1.3 冬小麦施肥配方优化
于2006及2016选择位于安徽、河北、河南和山东4个省内的24个试验点进行施肥配方优化试验,这些试验点分布相对均匀,土壤pH及基本肥力水平及所用品种见表3。
表 3 2006和2016年北方冬小麦试验点土壤基本情况Table 3. Basic situation of winter wheat fertilization test in north of China in 2006 and 2016年份
Year省份
Province县/市
County/CitypH 有机质 (g/kg)
Organic matter有效磷 (mg/kg)
Available P速效钾 (mg/g)
Available K品种
Cultivar2006 安徽 Anhui 利辛 Lixin 8.13 11.2 19.6 132 淮麦15 Huaimai 15 宿州 Suzhou 6.54 17.3 18.3 127 温麦6 Wenmai 6 利辛 Lixin 7.71 10.1 11.2 60 淮麦15 Huimai 15 河北 Hebei 邯郸 Handan 7.50 17.7 9.8 87 石新733 Shixin 733 新乐 Xinle 6.90 11.8 13.2 105 石麦15 Shimai 15 邢台 Xingtai 7.14 9.11 14.2 132 石新733 Shixin 733 河南 Henan 夏邑 Xiayi 8.02 11.4 32.0 147 郑麦9023 Zhengmai 9023 方城 Fangcheng 7.79 16.0 8.1 90 温麦6号 Wenmai 6 南阳 Nanyang 8.01 17.6 11.0 95 开麦13 Kaimai 13 山东 Shandong 济宁 Nining 6.71 36.0 7.0 126 济宁16号 Jining 16 泰安 Tai'an 8.85 9.03 36.2 85 淄麦12号 Zimai 12 菏泽 Heze 7.43 13.5 15.8 105 潍麦9009 Weimai 9009 2016 江苏 Jiangsu 徐州 Xuzhou 8.01 17.3 13.8 103 烟农19 Yannong 19 安徽 Anhui 阜阳 Fuyang 8.13 17.0 18.6 156 连麦2 Lianmai 2 宿州 Suzhou 7.95 14.5 19.7 95 连麦2 Lianmai 2 河北 Hebei 石家庄 Shijiazhuang 8.67 16.4 22.7 154 衡观35 Hengguan 35 辛集 Xinji 8.79 18.7 22.9 149 冀5265 Ji 5265 永年 Yongnian 7.56 12.1 28.6 126 温麦6 Wenmai 6 河南 Henan 浚县 Xunxian 5.05 16.2 12.6 129 矮抗58 Aikang 58 南阳 Nanyang 5.47 16.9 23.0 156 矮抗58 Aikang 58 许昌 Xuchang 8.59 13.8 19.5 105 4110 山东 Shandong 德州 Dezhou 9.02 10.0 11.9 93.0 济麦22 Jimai 22 青州 Qingzhou 7.56 12.0 14.0 113 济南17 Jiman 17 潍坊 Weifang 7.28 23.3 24.3 96.0 良星99 Liangxing 99 田间试验包括4个处理,3次重复,随机区组设计,试验详情见表4。处理 1:常规施肥 (CK),供试肥料为当年市场上销量最大的复合肥,2006年复合肥N–P2O5–K2O配比为16–16–10,2016年为18–22–10;处理2: 2006年比处理1增加2%氮肥,2016年比处理1减少2%氮肥,磷、钾用量同处理1;处理3:2006年比处理1增加2%磷肥,2016年比处理1减少2%磷肥,氮、钾用量同处理1;处理4:比处理1减少2%钾肥,氮、磷用量同处理1。
表 4 冬小麦施肥氮磷钾配比优化试验设计Table 4. Treatments of N, P2O5 and K2O adjustment for winter wheat (kg/hm2)处理
Treatment基肥 Basal dressing 追施氮
Top-dressing NN P2O5 K2O 2006 常规对照 Conventional control (N–P2O5–K2O=16–16–10) 96 96 60 69 增加2%氮肥 Increasing 2% N 108 96 60 69 增加2%磷肥 Increasing 2% P2O5 96 108 60 69 减少2%钾肥 Reducing 2% K2O 96 96 48 69 2016 常规对照 Conventional control (N-P2O5–K2O=18–22–10) 108 132 60 69 减少2%氮肥 Reducing 2% N 96 132 60 69 减少2%磷肥 Reducing 2% P2O5 108 120 60 69 减少2%钾肥 Reducing 2% K2O 108 132 48 69 复合肥在市场上采购,氮、磷、钾肥分别用尿素、磷酸二铵、氯化钾。磷、钾全部作基肥,氮肥以基肥和追肥施用。除肥料外,田间灌溉、除草和病虫害防治等管理措施均采用当地常规方法。所有品种均为当地主栽品种。
所有数据由Excel 2010整理,SPSS 17.0 软件做方差分析。用LSD分析处理间的差异 (P < 0.05为显著)。
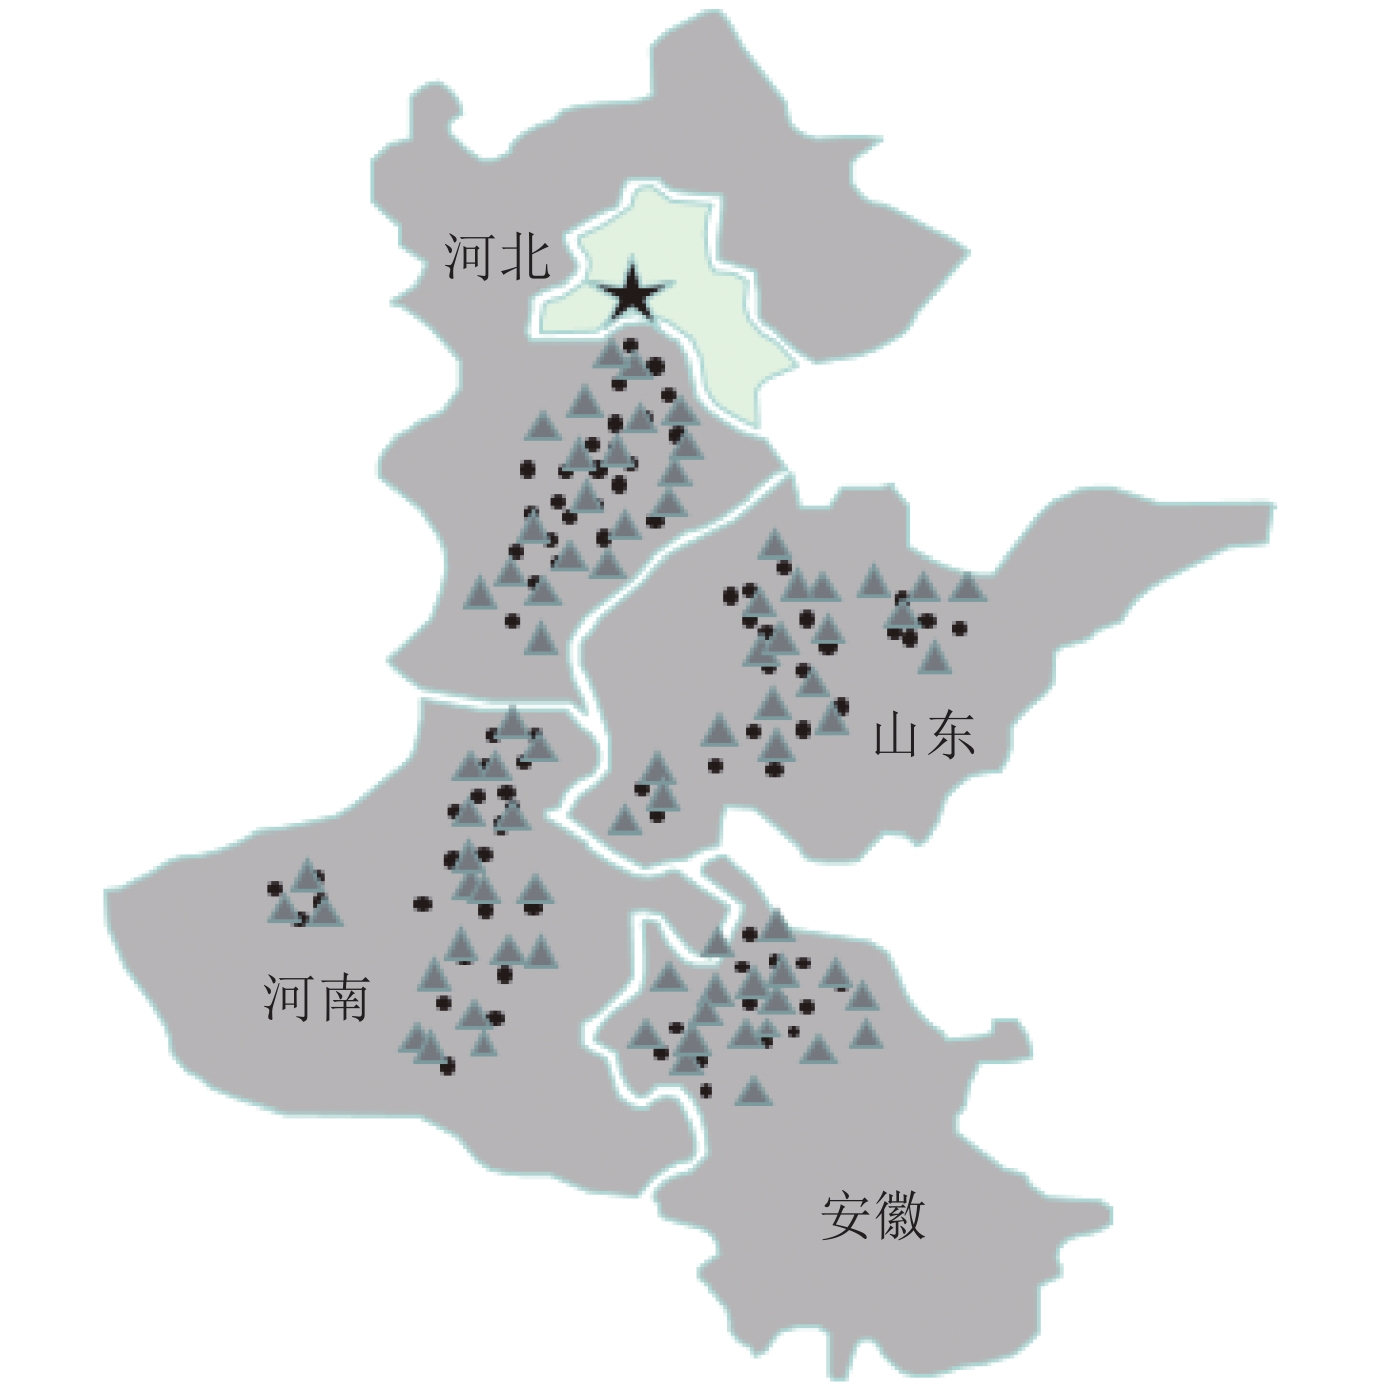
![]() 图 1 北方冬小麦试验地点分布[注(Note):黑色点代表农学效率试验地点The black dots represent the locations of agronomic efficiency experiment;灰色三角形代表产量效应试验点The grey triangles represent the locations of yield response experiment.]Figure 1. Fertilization experimental locations of winter wheat in north of China
图 1 北方冬小麦试验地点分布[注(Note):黑色点代表农学效率试验地点The black dots represent the locations of agronomic efficiency experiment;灰色三角形代表产量效应试验点The grey triangles represent the locations of yield response experiment.]Figure 1. Fertilization experimental locations of winter wheat in north of China2. 结果与分析
2.1 农田施肥对冬小麦产量和肥料农学效率的影响
通过4个省96个小麦生产地区14年的试验监测可以看出,施肥提高了小麦的地力产量而降低了肥料农学效率 (表5)。在不施肥条件下,从2002年到2016年小麦平均地力产量持续增加,由2002年的4721 kg/hm2增加到2016年的5828 kg/hm2,增加了23.4%,年平均增加1.6%。在施肥条件下,从2002年至2016年小麦产量也呈增加趋势,而施肥增产率呈下降趋势。2016年的小麦产量只比2002年增加了16.8%,施肥增产幅度小于同期不施肥的小麦增产幅度。另外,施肥条件下,2012—2016期间的小麦单位面积产量比2002—2006期间增加12.6%。
表 5 2002—2016年冬小麦产量和肥料农学效率Table 5. Wheat yield and fertilizer agronomic efficiency in north of China from 2002 to 2016年份
Year试验点
Experiment locations不施肥产量 (kg/hm2)
Yield in CK施肥产量 (kg/hm2)
Yield in treatment增产率 (%)
Yield increase肥料农学效率 (kg/kg)
Agronomic efficiency2002 21 4721.1 ± 731.9 5999.3 ± 824.0 27.1 9.0 ± 4.2 2005 24 4856.9 ± 946.5 6359.0 ± 715.1 30.9 8.2 ± 2.9 2006 15 5092.1 ± 553.2 6421.1 ± 623.9 26.1 8.0 ± 1.8 2007 27 5390.2 ± 567.7 6632.9 ± 731.2 23.1 7.8 ± 2.8 2008 36 5472.8 ± 880.2 6717.8 ± 666.4 22.7 7.2 ± 2.1 2009 33 5684.9 ± 537.2 6877.5 ± 661.8 21.0 7.3 ± 2.9 2010 27 5758.5 ± 851.7 6941.6 ± 438.6 20.5 6.7 ± 1.8 2011 24 5797.1 ± 839.7 7037.5 ± 729.8 21.4 6.3 ± 2.6 2012 30 5805.3 ± 678.3 7132.3 ± 678.3 22.9 6.5 ± 2.4 2013 36 5832.0 ± 769.5 7015.4 ± 599.1 20.3 6.4 ± 2.1 2016 30 5828.3 ± 799.1 7007.0 ± 612.2 20.2 6.5 ± 1.8 注(Note):数据为平均值 ± 标准差 The data are mean ± SD. 2002年至2010年肥料农学效率由9.0 kg/kg下降至6.7 kg/kg,年均下降0.28 kg/kg,2010年后肥料农学效率维持在6.3~6.7 kg/kg,变化幅度较小 (表6)。
表 6 不同时间段氮、磷、钾在冬小麦上的产量效应Table 6. Yield response of winter wheat to N, P and K fertilizer in different experimental periods年份
Year主处理
Main factor副处理
Secondary factor肥料效应系数
Coefficient of fertilizer
response functionR2 最高产量
Max. yield
(kg/hm2)施肥量 (kg/hm2)
Fertilization ratea b c 最高产量
施肥量
Max.最佳经济
用量
Opt.经济合理
用量
Reas.2002—2006 N 低量磷钾 Low P and K 0.0961 28.445 4704.3 0.9063 6809.2 148.0 137.1 126.7 中量磷钾 Mid P and K 0.0741 29.723 4513.4 0.9891 7494.0 200.6 186.4 172.3 高量磷钾 High P and K 0.0828 31.938 4289.9 0.9934 7369.7 192.9 180.2 167.5 P2O5 低量氮钾 Low N and K 0.5415 94.324 3184.1 0.9248 7291.7 87.1 84.6 83.3 中量氮钾 Mid N and K 0.1858 45.613 4981.0 0.9186 7780.4 122.8 115.5 111.7 高量氮钾 High N and K 0.2771 62.309 4024.7 0.9350 7527.4 112.4 107.6 105.0 K2O 低量氮磷 Low N and P 0.7479 84.266 5281.0 0.9123 7654.8 56.3 54.4 53.6 中量氮磷 Mid N and P 0.7662 87.486 5238.8 0.9530 7736.1 57.1 55.2 54.4 高量氮磷 High N and P 0.5211 56.703 5422.5 0.9574 6965.0 54.4 51.6 50.4 2012—2016 N 低量磷钾 Low P and K 0.0911 33.660 4709.0 0.9677 7809.2 184.7 173.2 161.9 中量磷钾 Mid P and K 0.0739 28.536 5055.0 0.9988 7818.8 193.1 178.9 164.7 高量磷钾 High P and K 0.0863 30.243 4924.0 0.9927 7573.6 175.2 163.1 150.9 P2O5 低量氮钾 Low N and K 0.2628 57.177 4474.1 0.9905 7584.1 108.8 103.7 100.8 中量氮钾 Mid N and K 0.1851 50.358 4636.2 0.9858 8061.3 136.0 128.7 124.7 高量氮钾 High N and K 0.1822 47.555 4787.5 0.9773 7890.5 130.5 123.1 119.0 K2O 低量氮磷 Low N and P 0.3561 35.025 6732.1 0.8537 7593.3 49.2 45.1 43.5 中量氮磷 Mid N and P 0.4147 45.607 6720.6 0.9526 7974.5 55.0 51.5 50.0 高量氮磷 High N and P 0.3781 40.142 6790.0 0.9348 7855.5 53.1 49.3 47.6 注(Note):2002—2006 年高、中、低氮量分别为 220、180、140 kg/hm2; 2002—2006 年高、中、低磷量分别为 120、100、80 kg/hm2; 2002—2006 年高、中、低钾量分别为 70、50、20 kg/hm2; 2012—2016 年高、中、低氮量分别为 230、190、150 kg/hm2; 2012—2016 年高、中、低磷量分别为 140、120、90 kg/hm2; 2012—2016 年高、中、低钾量分别为 90、70、50 kg/hm2. High, middle and low N input was 220 kg/hm2, 180 kg/hm2, 140 kg/hm2 from 2002 to 2006; High, middle and low P input was 120 kg/hm2, 100 kg/hm2, 80 kg/hm2 from 2002 to 2006; high, middle and low K input was 70 kg/hm2, 50 kg/hm2, 20 kg/hm2 from 2002 to 2006; high, middle and low N input was 230 kg/hm2, 190 kg/hm2, 150 kg/hm2 from 2012 to 2016; high, middle and low P input was 140 kg/hm2, 120 kg/hm2, 90 kg/hm2 from 2012 to 2016; high, middle and low K input was 90 kg/hm2, 70 kg/hm2, 50 kg/hm2 from 2012 to 2016. Max.—Fertilizaiton rate for the maximum yield; Opt—Optimum fertilizer rate; Reas—Reasonable fertilizer application rate. 肥料效应函数 Fertilizer effect function: y = ax2 + bx + c; Wheat 2.0 yuan/kg; N 4.35 yuan/kg; P2O5 5.43 yuan/kg;K2O 5.83 yuan/kg. 2.2 氮、磷、钾不同施用水平对冬小麦的产量效应及变化规律
2002—2006及2012—2016两个时间段内的试验结果分别基于肥料效应函数y = ax2 + bx + c 进行分析 (表6)。结果显示,2002—2006年小麦获得最高产量时N、P2O5、K2O平均用量分别为180.5、107.4、55.9 kg/hm2;平均经济最佳用量分别为167.8、102.5、53.7 kg/hm2;平均经济合理用量 (R = 0.1) 分别为155.5、99.9、52.8 kg/hm2。2012—2016年小麦获得最高产量时N、P2O5、K2O平均施肥量分别为184.3、125.1、52.4 kg/hm2;平均经济最佳用量分别为171.7、118.5、48.6 kg/hm2;平均经济合理用量 (R = 0.1) 分别为159.2、114.9、47.0 kg/hm2。
在2002—2006年和2012—2016年的两个时间段内,当氮为主处理、磷钾为副处理时,中水平磷钾对应的小麦经济最佳氮用量和经济合理氮用量最高,其次是磷钾为高水平时的氮用量,而磷钾为低水平时的经济最佳氮用量和经济合理氮用量最低。当磷为主处理氮钾为副处理时,经济最佳磷用量和经济合理磷用量规律与氮肥相同。经济最佳钾用量和经济合理钾用量在低、中氮磷水平下用量较高,两种条件下没有明显差异,而在高氮磷水平下用量较低。
将2002—2006年与2012—1016年两个时间段比较,小麦获得最高产量时的氮用量无明显差异;2002—2006年期间小麦获得最高产量时的磷用量明显低于2012—2016年时间段内小麦获得最高产量的磷用量,而钾用量略高。经济最佳用量和经济合理用量呈相同规律。
2.3 冬小麦施肥配方优化
2.3.1 冬小麦氮、磷、钾施肥比例
经济合理施肥量反映了最优施肥投资收益,更符合农户的实际需求[9],因此我们进一步采用经济合理施肥量计算施肥配方。通常冬小麦生产中使用600 kg/hm2复合肥做基肥,追施氮肥 (N) 69.0 kg/hm2,根据1.2的试验,我们采用氮、磷、钾在副处理“中量磷钾”“中量氮钾”和“中量氮磷”的经济合理用量值计算冬小麦复合肥中氮、磷、钾比例。2002—2006年,这3个值分别为172.3、111.6和54.0 kg/hm2 (表6),则复合肥中氮、磷、钾含量分别为 N = (172.3−69.0)/600.0 × 100% = 17.2%,P2O5 = 111.6/600.0 × 100% = 18.6%,K2O = 54.0/600.0 × 100% = 9.0%。即2002—2006年时间段内冬小麦所用复合肥氮 (N)、磷 (P2O5)、钾 (K2O) 配比为1.0–1.08–0.52。2012—2016年,氮、磷、钾在副处理“中量磷钾”“中量氮钾”和“中量氮磷”中的经济合理用量值分别为164.7、124.7和50 kg/hm2 (表6),计算得复合肥中氮、磷、钾含量为N 16.0%、P2O5 20.8%、K2O 8.3%,因此2012—2016年冬小麦复合肥氮 (N)、磷 (P2O5)、钾 (K2O) 配比为1.0–1.3–0.51。
2006年农民习惯施肥的氮 (N)、磷 (P2O5)、钾 (K2O) 配比为16–16–10,与冬小麦生产所需的理论配比相比,氮肥和磷肥的比例略低,而钾肥配比比正常需要量大约多60%。所以施肥优化方案应该增加肥料中的氮、磷含量,减少钾的含量。2016年农民习惯施肥的氮 (N)、磷 (P2O5)、钾 (K2O) 配比为18–22–10,与理论配比相比,氮、磷、钾肥均偏多,所以冬小麦生产的优化施肥方案是减少氮、磷、钾的用量。
2.3.2 冬小麦施肥配方优化田间试验
根据冬小麦施肥配方优化试验结果 (表7) 可知,2006年,与常规配方处理1相比,增氮2%、增磷2%处理分别使冬小麦平均增产5.8%和6.8%,差异均达到显著水平;减钾2%处理中小麦产量与处理1相比无显著变化。即在北方冬小麦区常规施肥配方中增施2%氮或2%磷均能使小麦产量显著增加,而减少2%钾对小麦产量没有显著影响。因此,冬小麦施肥氮 (N)、磷 (P2O5)、钾 (K2O) 配比16–16–10可调为18–18–8。
表 7 2006和2016年北方冬小麦优化配方施肥产量 (kg/hm2) 及相对原配方的增长率 (%)Table 7. Yield and yield increase of winter wheat in optimized compound fertilizer formula over the original one in north of China in 2006 and 2016年份
Year地点
Location原配方
Original formula (kg/hm2)增氮配方
Increased N formula增磷配方
Increased P formula减钾配方
Decreased K formula(kg/hm2) (%) (kg/hm2) (%) (kg/hm2) (%) 2006 安徽 Anhui 利辛 Lixin 7795.8 b 8235.2 a 5.6 8231.4 a 5.6 7789.3 b –0.1 宿州 Suzhou 4954.5 b 5311.5 a 7.2 5322.0 a 7.4 5012.7 a 1.2 利辛 Lixin 6435.0 b 6830.5 a 6.1 6850.0 a 6.4 6469.2 b 0.5 河北 Hebei 邯郸 Handan 5610.0 a 5760.0 a 2.7 5980.0 a 6.6 5730.0 a 2.1 新乐 Xinle 7962.0 b 8496.0 a 6.7 8332.1 a 4.6 8032.0 a 0.9 邢台 Xingtai 6784.3 b 7283.0 a 7.4 7197.1 a 6.0 6778.3 b –0.1 河南 Henan 夏邑 Xiayi 6162.0 b 6509.0 a 5.6 6634.8 a 7.8 6332.5 a 2.8 方城 Fangcheng 7563.0 b 7857.5 a 3.9 7878.9 a 4.2 7743.0 a 2.4 南阳 Nanyang 6003.0 b 6403.5 a 6.7 6300.5 a 4.7 6203.5 a 3.3 山东 Shandong 济宁 Jining 8205.0 b 8645.0 a 5.4 8374.0 a 16.2 8314.5 a 1.3 泰安 Tai'an 7272.0 b 7690.0 a 5.7 7662.0 a 5.3 7309.5 a 0.5 菏泽 Heze 6399.0 b 6782.5 a 6.0 6852.0 a 7.0 6675.0 a 4.3 平均 Mean 6762.1 b 7150.3 a 5.8 7134.6 a 6.8 6865.8 b 1.6 2016 江苏 Jiangsu 徐州 Xuzhou 6166.8 a 6178.0 a 0.2 6418.4 a 4.1 6622.8 a 7.4 安徽 Anhui 阜阳 Fuyang 6948.0 a 7012.4 a 0.9 7639.5 a 10.0 6955.5 a 0.1 宿州 Suzhou 7290.0 a 7384.5 a 1.3 7679.2 a 5.3 7705.0 a 5.7 河北 Hebei 石家庄 Shijiazhuang 7242.0 a 7367.4 a 1.7 7546.9 a 5.6 7345.5 a 1.4 辛集 Xinji 7150.0 a 7349.6 a 2.8 7442.0 a 4.1 7175.5 a 0.3 永年 Yongnian 8673.0 a 8649.7 a –0.3 9267.1 a 6.8 8709.0 a 0.4 河南 Henan 浚县 Xunxian 8670.0 a 8744.5 a 0.9 8792.0 a 8.9 9045.0 a 4.3 南阳 Nanyang 8875.0 a 9121.6 a 2.7 9364.5 a 5.5 8912.5 a 0.4 许昌 Xuchang 6584.7 a 6673.4 a 1.3 7060.6 a 7.2 6829.1 a 3.7 山东 Shandong 德州 Dezhou 6694.8 a 6743.1 a 0.7 7041.2 a 5.2 6886.4 a 2.9 青州 Qingzhou 7952.4 a 8031.9 a 1.0 8643.3 a 8.6 7976.5 a –0.1 潍坊 Weifang 6797.5 a 6874.2 a 1.1 7264.7 a 8.3 6874.2 a 0.3 平均 Mean 7420.4 a 7510.9 a 1.2 7846.6 a 6.6 7586.4 a 2.2 注(Note):2006 年增氮磷配方分别较原配方增加 2%,减钾配方减少 2%; 2016 年试验 NPK 处理较原配方均减少了 2%。数据后不同小写字母表示同一地点小麦产量在不同处理间差异达 0.05 显著水平 In NPK treatment of 2006, N and P were added by 2% and K was decreased by 2%, compared with the original formula; In NPK treatments of 2016 the N, P and K inputs were all decreased by 2%, compared with the original formula. Different lowercase letters indicate significant difference among treatments in the same location at 0.05 level. 2016年,与常规配方处理比较,氮肥减少2%后小麦产量没有发生显著变化,即氮肥减少2%没有造成小麦减产;磷肥减少2%使小麦产量平均增加6.6%;减钾2%处理中,91%试验点的小麦产量没有发生显著变化,变幅低于5%。因此,小麦生产施肥氮 (N)、磷 (P2O5)、钾 (K2O) 为18–22–10可统一调低2%,即为16–20–8。此施肥配方比常规配方氮、磷、钾的总量减少12.0%,同时没有造成小麦明显减产。
比较2016年与2006年小麦生产氮、磷、钾优化配比发现,针对当前市场上肥料配比现状,我们在生产中应该适当降低氮肥施用量,适当增加磷肥施用量,而钾肥可以保持不变。华北地区小麦生产中施肥氮 (N)、磷 (P2O5)、钾 (K2O) 优化配比为16–20–8。
3. 讨论
3.1 土壤供肥能力变化对推荐施肥量的影响
过量施肥往往造成养分在土壤中累积,土壤养分供应能力逐渐增强[19-21]。在1978—2008年30年间,太行山山麓平原冬小麦生产地区土壤供应氮、磷、钾的能力分别增加了37.9、0.7、2.1个百分点[6]。过量施肥导致肥料利用率下降、土壤养分累积等问题引起了广泛关注:张福锁等[22]和闫湘等[23]统计分析了中国2001—2005年粮食作物氮、磷、钾利用率;朱兆良[24]分析了中国1998年粮食作物氮、磷、钾利用率。以上研究结果发现,近年来中国粮食作物肥料利用率呈下降趋势。本研究也发现,小麦地力产量由于施肥过量而逐年增加;但是施肥量增幅高于产量增幅,导致肥料的农学效率、施肥增产率总体呈逐年下降趋势。
1986年,杨守春等[12]根据多年多点试验效应函数计算出我国黄淮海地区小麦的最高理论产量为5031 kg/hm2,获得最高产量所需N、P2O5分别为183.3、160.5 kg/hm2。本研究计算2016年冬小麦最高产量为7796 kg/hm2,获得最高产量的平均N、P2O5用量分别为184.3、125.1 kg/hm2。此结果与1986年的结果相比,理论最高产量增加了54.9%,氮肥用量一致,磷肥用量下降22.0%,即2016年磷肥用量减少22.0%,但小麦产量增产54.9%。这些结果说明,过量施用氮肥增加了氮肥损失,降低氮肥增产效应,也使土壤供氮量变幅减少;过量施用磷肥导致土壤磷积累,土壤供磷量明显增加,使高产时磷肥推荐量逐渐降低。这些结果都为当前推荐施肥和减肥增效提供了有力的理论支撑。
另外,本研究还设计了不同肥力下的氮磷钾肥料效应田间试验,其中不同肥力水平代表不同的土壤供肥能力。此试验结果表明,中、低肥力下,肥料效应函数计算出的氮、磷、钾用量与基础施肥水平呈正相关;而高量施肥时则相反,这与20世纪80年代杨守春等[12]的研究结果一致。对于钾肥产量效应,不同施肥水平下钾肥推荐用量变化幅度较小,这可能与连续秸秆还田后提高了土壤供钾能力,进而降低了钾肥产量效应有关,在生产实践中,农户不施用钾肥未造成小麦显著减产的情况也确实比较普遍。
3.2 田间试验优化施肥配方
根据多年多点试验,华北地区冬小麦氮、磷、钾最佳经济施肥量分别为163.1~173.2、103.7~128.7、45.1~51.5 kg/hm2,其中氮、磷推荐量与其他学者研究结果基本一致[25-26]。另外,本研究计算出华北冬小麦氮 (N)、磷 (P2O5)、钾 (K2O) 优化配比为16–20–8,此结果与农业部2014年推荐配比15–20–12[27]相比,氮、磷占比基本一致但钾的用量降低,这可能是近年来秸秆还田的结果。在秸秆还田过程中,秸秆中的钾肥随秸秆重新进入耕地,土壤中钾肥含量损失相对较少,因此钾肥用量降低。受条件限制,本研究仅对北方灌区冬小麦施肥配方进行了优化,并没有研究北方雨养冬小麦区的最佳施肥方案。肥料产量效应田间校验法是将现有肥料配方与施肥产量效应试验结果进行对比,对现有肥料配方进行田间校验,同时结合肥料生产条件和成本因素制定肥料配方的方法。此方法以企业现有配方为基础,依据施肥产量效应试验对肥料配方进行调整,一方面保证肥料配方科学性,另一方面适应肥料规模化生产的需要,简便可行。2016年肥料配比经过肥料产量效应田间校验法优化后,比原配方氮、磷、钾共减量12.0%,未造成小麦明显减产,实现了农业推荐施肥技术与工业生产的有机结合。
4. 结论
从2002年至2016年,北方冬小麦土壤供肥能力逐渐提高,平均地力产量由2002年的4721.1 kg/hm2增加到2016年的5828.3 kg/hm2,年均增加1.6%。施用氮磷钾能显著增加冬小麦产量,但氮磷钾的增产率总体呈逐渐下降趋势;氮磷钾农学效率由2002年的9.0 kg/kg逐渐降低至2010年后的6.3~6.7 kg/kg,年均降低0.28 kg/kg。冬小麦优化N–P2O5–K2O配比为16–20–8,推荐施肥方案为基肥施用该配方复合肥600 kg/hm2,追施氮 69 kg/hm2。
-
![]()
图 1 北方冬小麦试验地点分布
[注(Note):黑色点代表农学效率试验地点The black dots represent the locations of agronomic efficiency experiment;灰色三角形代表产量效应试验点The grey triangles represent the locations of yield response experiment.]
Figure 1. Fertilization experimental locations of winter wheat in north of China
表 1 冬小麦试验点土壤基本性状
Table 1 Soil properties of experiment locations in North China
年份
YearpH 有机质 Organic matter (g/kg) 有效磷 Available P (mg/kg) 速效钾 Available K (mg/kg) 范围
Range均值 ± SD
Mean ± SD范围
Range均值 ± SD
Mean ± SD范围
Range均值 ± SD
Mean ± SD范围
Range均值 ± SD
Mean ± SD2002—2006 6.50~8.31 7.52 ± 0.63 9.06~36.0 14.0 ± 6.2 6.90~46.0 27.2 ± 12.0 56.4~270 105 ± 48.0 2012—2016 6.90~8.03 7.51 ± 0.41 8.01~28.7 15.0 ± 9.3 18.0~59.0 21.8 ± 11.3 43.3~287 108 ± 48.3  下载: 导出CSV
表 2 试验设计及各因素水平
Table 2 Levels of main and secondary factors in split-plot design
年份
Year主处理
Main factor主处理水平 (kg/hm2)
Main factor levels副处理
Secondary factor副处理水平 (kg/hm2)
Secondary factor levels试验点数
Experiment number2002—2006 N 105, 135, 150, 165, 180, 210, 240 低量磷钾 Low P and K P2O5 80, K2O 20 19 中量磷钾 Mid P and K P2O5 100, K2O 50 高量磷钾 High P and K P2O5 120, K2O 70 P2O5 75, 90, 105, 120, 135, 150 低量氮钾 Low N and K N 140, K2O 20 20 中量氮钾 Mid N and K N 180, K2O 50 高量氮钾 High N and K N 220, K2O 70 K2O 15, 30, 45, 60, 90 低量氮磷 Low N and P N 140, P2O5 80 21 中量氮磷 Mid N and P N 180, P2O5 100 高量氮磷 High N and P N 220, P2O5 120 2012—2016 N 150, 180, 195, 210, 225, 240 低量磷钾 Low P and K P2O5 90, K2O 20 19 中量磷钾 Mid P and K P2O5 120, K2O 50 高量磷钾 High P and K P2O5140, K2O 70 P2O5 75, 90, 105, 120, 135, 150 低量氮钾 Low N and K N 150, K2O 20 21 中量氮钾 Mid N and K N 190, K2O 50 高量氮钾 High N and K N 230, K2O 70 K2O 15, 30, 45, 60, 90 低量氮磷 Low N and P N 150, P2O5 90 20 中量氮磷 Mid N and P N 190, P2O5 120 高量氮磷 High N and P N 230, P2O5 140
下载: 导出CSV
表 3 2006和2016年北方冬小麦试验点土壤基本情况
Table 3 Basic situation of winter wheat fertilization test in north of China in 2006 and 2016
年份
Year省份
Province县/市
County/CitypH 有机质 (g/kg)
Organic matter有效磷 (mg/kg)
Available P速效钾 (mg/g)
Available K品种
Cultivar2006 安徽 Anhui 利辛 Lixin 8.13 11.2 19.6 132 淮麦15 Huaimai 15 宿州 Suzhou 6.54 17.3 18.3 127 温麦6 Wenmai 6 利辛 Lixin 7.71 10.1 11.2 60 淮麦15 Huimai 15 河北 Hebei 邯郸 Handan 7.50 17.7 9.8 87 石新733 Shixin 733 新乐 Xinle 6.90 11.8 13.2 105 石麦15 Shimai 15 邢台 Xingtai 7.14 9.11 14.2 132 石新733 Shixin 733 河南 Henan 夏邑 Xiayi 8.02 11.4 32.0 147 郑麦9023 Zhengmai 9023 方城 Fangcheng 7.79 16.0 8.1 90 温麦6号 Wenmai 6 南阳 Nanyang 8.01 17.6 11.0 95 开麦13 Kaimai 13 山东 Shandong 济宁 Nining 6.71 36.0 7.0 126 济宁16号 Jining 16 泰安 Tai'an 8.85 9.03 36.2 85 淄麦12号 Zimai 12 菏泽 Heze 7.43 13.5 15.8 105 潍麦9009 Weimai 9009 2016 江苏 Jiangsu 徐州 Xuzhou 8.01 17.3 13.8 103 烟农19 Yannong 19 安徽 Anhui 阜阳 Fuyang 8.13 17.0 18.6 156 连麦2 Lianmai 2 宿州 Suzhou 7.95 14.5 19.7 95 连麦2 Lianmai 2 河北 Hebei 石家庄 Shijiazhuang 8.67 16.4 22.7 154 衡观35 Hengguan 35 辛集 Xinji 8.79 18.7 22.9 149 冀5265 Ji 5265 永年 Yongnian 7.56 12.1 28.6 126 温麦6 Wenmai 6 河南 Henan 浚县 Xunxian 5.05 16.2 12.6 129 矮抗58 Aikang 58 南阳 Nanyang 5.47 16.9 23.0 156 矮抗58 Aikang 58 许昌 Xuchang 8.59 13.8 19.5 105 4110 山东 Shandong 德州 Dezhou 9.02 10.0 11.9 93.0 济麦22 Jimai 22 青州 Qingzhou 7.56 12.0 14.0 113 济南17 Jiman 17 潍坊 Weifang 7.28 23.3 24.3 96.0 良星99 Liangxing 99
下载: 导出CSV
表 4 冬小麦施肥氮磷钾配比优化试验设计
Table 4 Treatments of N, P2O5 and K2O adjustment for winter wheat (kg/hm2)
处理
Treatment基肥 Basal dressing 追施氮
Top-dressing NN P2O5 K2O 2006 常规对照 Conventional control (N–P2O5–K2O=16–16–10) 96 96 60 69 增加2%氮肥 Increasing 2% N 108 96 60 69 增加2%磷肥 Increasing 2% P2O5 96 108 60 69 减少2%钾肥 Reducing 2% K2O 96 96 48 69 2016 常规对照 Conventional control (N-P2O5–K2O=18–22–10) 108 132 60 69 减少2%氮肥 Reducing 2% N 96 132 60 69 减少2%磷肥 Reducing 2% P2O5 108 120 60 69 减少2%钾肥 Reducing 2% K2O 108 132 48 69
下载: 导出CSV
表 5 2002—2016年冬小麦产量和肥料农学效率
Table 5 Wheat yield and fertilizer agronomic efficiency in north of China from 2002 to 2016
年份
Year试验点
Experiment locations不施肥产量 (kg/hm2)
Yield in CK施肥产量 (kg/hm2)
Yield in treatment增产率 (%)
Yield increase肥料农学效率 (kg/kg)
Agronomic efficiency2002 21 4721.1 ± 731.9 5999.3 ± 824.0 27.1 9.0 ± 4.2 2005 24 4856.9 ± 946.5 6359.0 ± 715.1 30.9 8.2 ± 2.9 2006 15 5092.1 ± 553.2 6421.1 ± 623.9 26.1 8.0 ± 1.8 2007 27 5390.2 ± 567.7 6632.9 ± 731.2 23.1 7.8 ± 2.8 2008 36 5472.8 ± 880.2 6717.8 ± 666.4 22.7 7.2 ± 2.1 2009 33 5684.9 ± 537.2 6877.5 ± 661.8 21.0 7.3 ± 2.9 2010 27 5758.5 ± 851.7 6941.6 ± 438.6 20.5 6.7 ± 1.8 2011 24 5797.1 ± 839.7 7037.5 ± 729.8 21.4 6.3 ± 2.6 2012 30 5805.3 ± 678.3 7132.3 ± 678.3 22.9 6.5 ± 2.4 2013 36 5832.0 ± 769.5 7015.4 ± 599.1 20.3 6.4 ± 2.1 2016 30 5828.3 ± 799.1 7007.0 ± 612.2 20.2 6.5 ± 1.8 注(Note):数据为平均值 ± 标准差 The data are mean ± SD.
下载: 导出CSV
表 6 不同时间段氮、磷、钾在冬小麦上的产量效应
Table 6 Yield response of winter wheat to N, P and K fertilizer in different experimental periods
年份
Year主处理
Main factor副处理
Secondary factor肥料效应系数
Coefficient of fertilizer
response functionR2 最高产量
Max. yield
(kg/hm2)施肥量 (kg/hm2)
Fertilization ratea b c 最高产量
施肥量
Max.最佳经济
用量
Opt.经济合理
用量
Reas.2002—2006 N 低量磷钾 Low P and K 0.0961 28.445 4704.3 0.9063 6809.2 148.0 137.1 126.7 中量磷钾 Mid P and K 0.0741 29.723 4513.4 0.9891 7494.0 200.6 186.4 172.3 高量磷钾 High P and K 0.0828 31.938 4289.9 0.9934 7369.7 192.9 180.2 167.5 P2O5 低量氮钾 Low N and K 0.5415 94.324 3184.1 0.9248 7291.7 87.1 84.6 83.3 中量氮钾 Mid N and K 0.1858 45.613 4981.0 0.9186 7780.4 122.8 115.5 111.7 高量氮钾 High N and K 0.2771 62.309 4024.7 0.9350 7527.4 112.4 107.6 105.0 K2O 低量氮磷 Low N and P 0.7479 84.266 5281.0 0.9123 7654.8 56.3 54.4 53.6 中量氮磷 Mid N and P 0.7662 87.486 5238.8 0.9530 7736.1 57.1 55.2 54.4 高量氮磷 High N and P 0.5211 56.703 5422.5 0.9574 6965.0 54.4 51.6 50.4 2012—2016 N 低量磷钾 Low P and K 0.0911 33.660 4709.0 0.9677 7809.2 184.7 173.2 161.9 中量磷钾 Mid P and K 0.0739 28.536 5055.0 0.9988 7818.8 193.1 178.9 164.7 高量磷钾 High P and K 0.0863 30.243 4924.0 0.9927 7573.6 175.2 163.1 150.9 P2O5 低量氮钾 Low N and K 0.2628 57.177 4474.1 0.9905 7584.1 108.8 103.7 100.8 中量氮钾 Mid N and K 0.1851 50.358 4636.2 0.9858 8061.3 136.0 128.7 124.7 高量氮钾 High N and K 0.1822 47.555 4787.5 0.9773 7890.5 130.5 123.1 119.0 K2O 低量氮磷 Low N and P 0.3561 35.025 6732.1 0.8537 7593.3 49.2 45.1 43.5 中量氮磷 Mid N and P 0.4147 45.607 6720.6 0.9526 7974.5 55.0 51.5 50.0 高量氮磷 High N and P 0.3781 40.142 6790.0 0.9348 7855.5 53.1 49.3 47.6 注(Note):2002—2006 年高、中、低氮量分别为 220、180、140 kg/hm2; 2002—2006 年高、中、低磷量分别为 120、100、80 kg/hm2; 2002—2006 年高、中、低钾量分别为 70、50、20 kg/hm2; 2012—2016 年高、中、低氮量分别为 230、190、150 kg/hm2; 2012—2016 年高、中、低磷量分别为 140、120、90 kg/hm2; 2012—2016 年高、中、低钾量分别为 90、70、50 kg/hm2. High, middle and low N input was 220 kg/hm2, 180 kg/hm2, 140 kg/hm2 from 2002 to 2006; High, middle and low P input was 120 kg/hm2, 100 kg/hm2, 80 kg/hm2 from 2002 to 2006; high, middle and low K input was 70 kg/hm2, 50 kg/hm2, 20 kg/hm2 from 2002 to 2006; high, middle and low N input was 230 kg/hm2, 190 kg/hm2, 150 kg/hm2 from 2012 to 2016; high, middle and low P input was 140 kg/hm2, 120 kg/hm2, 90 kg/hm2 from 2012 to 2016; high, middle and low K input was 90 kg/hm2, 70 kg/hm2, 50 kg/hm2 from 2012 to 2016. Max.—Fertilizaiton rate for the maximum yield; Opt—Optimum fertilizer rate; Reas—Reasonable fertilizer application rate. 肥料效应函数 Fertilizer effect function: y = ax2 + bx + c; Wheat 2.0 yuan/kg; N 4.35 yuan/kg; P2O5 5.43 yuan/kg;K2O 5.83 yuan/kg.
下载: 导出CSV
表 7 2006和2016年北方冬小麦优化配方施肥产量 (kg/hm2) 及相对原配方的增长率 (%)
Table 7 Yield and yield increase of winter wheat in optimized compound fertilizer formula over the original one in north of China in 2006 and 2016
年份
Year地点
Location原配方
Original formula (kg/hm2)增氮配方
Increased N formula增磷配方
Increased P formula减钾配方
Decreased K formula(kg/hm2) (%) (kg/hm2) (%) (kg/hm2) (%) 2006 安徽 Anhui 利辛 Lixin 7795.8 b 8235.2 a 5.6 8231.4 a 5.6 7789.3 b –0.1 宿州 Suzhou 4954.5 b 5311.5 a 7.2 5322.0 a 7.4 5012.7 a 1.2 利辛 Lixin 6435.0 b 6830.5 a 6.1 6850.0 a 6.4 6469.2 b 0.5 河北 Hebei 邯郸 Handan 5610.0 a 5760.0 a 2.7 5980.0 a 6.6 5730.0 a 2.1 新乐 Xinle 7962.0 b 8496.0 a 6.7 8332.1 a 4.6 8032.0 a 0.9 邢台 Xingtai 6784.3 b 7283.0 a 7.4 7197.1 a 6.0 6778.3 b –0.1 河南 Henan 夏邑 Xiayi 6162.0 b 6509.0 a 5.6 6634.8 a 7.8 6332.5 a 2.8 方城 Fangcheng 7563.0 b 7857.5 a 3.9 7878.9 a 4.2 7743.0 a 2.4 南阳 Nanyang 6003.0 b 6403.5 a 6.7 6300.5 a 4.7 6203.5 a 3.3 山东 Shandong 济宁 Jining 8205.0 b 8645.0 a 5.4 8374.0 a 16.2 8314.5 a 1.3 泰安 Tai'an 7272.0 b 7690.0 a 5.7 7662.0 a 5.3 7309.5 a 0.5 菏泽 Heze 6399.0 b 6782.5 a 6.0 6852.0 a 7.0 6675.0 a 4.3 平均 Mean 6762.1 b 7150.3 a 5.8 7134.6 a 6.8 6865.8 b 1.6 2016 江苏 Jiangsu 徐州 Xuzhou 6166.8 a 6178.0 a 0.2 6418.4 a 4.1 6622.8 a 7.4 安徽 Anhui 阜阳 Fuyang 6948.0 a 7012.4 a 0.9 7639.5 a 10.0 6955.5 a 0.1 宿州 Suzhou 7290.0 a 7384.5 a 1.3 7679.2 a 5.3 7705.0 a 5.7 河北 Hebei 石家庄 Shijiazhuang 7242.0 a 7367.4 a 1.7 7546.9 a 5.6 7345.5 a 1.4 辛集 Xinji 7150.0 a 7349.6 a 2.8 7442.0 a 4.1 7175.5 a 0.3 永年 Yongnian 8673.0 a 8649.7 a –0.3 9267.1 a 6.8 8709.0 a 0.4 河南 Henan 浚县 Xunxian 8670.0 a 8744.5 a 0.9 8792.0 a 8.9 9045.0 a 4.3 南阳 Nanyang 8875.0 a 9121.6 a 2.7 9364.5 a 5.5 8912.5 a 0.4 许昌 Xuchang 6584.7 a 6673.4 a 1.3 7060.6 a 7.2 6829.1 a 3.7 山东 Shandong 德州 Dezhou 6694.8 a 6743.1 a 0.7 7041.2 a 5.2 6886.4 a 2.9 青州 Qingzhou 7952.4 a 8031.9 a 1.0 8643.3 a 8.6 7976.5 a –0.1 潍坊 Weifang 6797.5 a 6874.2 a 1.1 7264.7 a 8.3 6874.2 a 0.3 平均 Mean 7420.4 a 7510.9 a 1.2 7846.6 a 6.6 7586.4 a 2.2 注(Note):2006 年增氮磷配方分别较原配方增加 2%,减钾配方减少 2%; 2016 年试验 NPK 处理较原配方均减少了 2%。数据后不同小写字母表示同一地点小麦产量在不同处理间差异达 0.05 显著水平 In NPK treatment of 2006, N and P were added by 2% and K was decreased by 2%, compared with the original formula; In NPK treatments of 2016 the N, P and K inputs were all decreased by 2%, compared with the original formula. Different lowercase letters indicate significant difference among treatments in the same location at 0.05 level.
下载: 导出CSV
-
[1] 中国国家统计局. 中国国家统计年鉴[EB]. http://www.stats.gov.cn/tjsj/ndsj/, 2018-6-28. National Bureau of Statistics of China. China national statistical yearbook[EB]. http://www.stats.gov.cn/tjsj/ndsj/, 2018-6-28.
[2] 崔振岭, 陈新平, 张福锁, 等. 华北平原小麦施肥现状影响小麦产量的因素分析[J]. 华北农学报, 2008, (S1): 224-229. DOI: 10.7668/hbnxb.2008.S1.053 Cui Z L, Chen X P, Zhang F S, et al. Analysis of the current situation of wheat fertilization and the factors affecting wheat yield in the North China Plain[J]. Journal of North China agriculture, 2008, (S1): 224-229. DOI: 10.7668/hbnxb.2008.S1.053
[3] Chen X P. Optimization of the fertilizer management of a winter wheat summer maize rotation system in the Northern China Plain[D]. Stuttgart, Germany: PhD Dissertation, University of Hohenheim, 2003.14–30.
[4] 赵久然. 北京郊区作物产量和氮肥施用的调查与分析[J]. 北京农业科学, 1997, 15: 36-38. Zhao J R. Investigation and analysis of crop yield and nitrogen application in Beijing suburbs[J]. Beijing Agricultural Science, 1997, 15: 36-38.
[5] 王法宏, 李汉元, 王旭清, 等. 当前山东小麦生产中存在的主要问题及技术对策[J]. 山东农业科学, 1998(4): 4-6. Wang F H, Li H Y, Wang X Q, et al. The main problems and technical countermeasures in wheat production in Shandong Province[J]. Shandong Agricultural Science, 1998, (4): 4-6.
[6] 刘建玲, 贾可, 廖文华, 等. 太行山山麓平原30年间土壤养分与供肥能力变化[J]. 土壤学报, 2015, 52(6): 1325-1335. Liu J L, Jia K, Liao W H, et al. Changes of soil nutrients and supply capacities in the piedmont plain of Taihang mountain during the period of 1978-2008[J]. Acta Pedologica Sinica, 2015, 52(6): 1325-1335.
[7] 张卫峰, 马文奇, 王雁峰, 张福锁. 中国农户小麦施肥水平和效应的评价[J]. 土壤通报, 2008 (5): 1049-1055. DOI: 10.3321/j.issn:0564-3945.2008.05.017 Zhang W F, Ma W Q, Wang Y F, Zhang F S. Evaluation of fertilization level and effect of wheat in Chinese farmers[J]. Chinese Journal of Soil Science, 2008, (5): 1049-1055. DOI: 10.3321/j.issn:0564-3945.2008.05.017
[8] 陈伦寿, 李仁岗. 农田施肥原理与实践[M]. 北京: 中国农业出版社, 1984. Chen L S, Li R G. The principles and practices of fertilizer application in croplands[M]. Beijing: China Agriculture Press, 1984.
[9] 李仁岗. 肥料效应函数[M]. 北京: 中国农业出版社, 1986. Li R G. Function of the yield response of crops to fertilizer[M]. Beijing: China Agriculture Press, 1986.
[10] Liu J L, Liao W L. Effect of phosphate fertilizer and manure on crop yield, soil P accumulation, and the environmental risk assessment[J]. Scientia Agricultura Sinica, 2007, 6(9): 1107-1114.
[11] 陈新平, 周金池, 王兴仁, 等. 小麦-玉米轮作制中氮肥效应模型的选择-经济和环境效益分析[J]. 土壤学报, 2000, 37(3): 346-353. DOI: 10.3321/j.issn:0564-3929.2000.03.008 Chen X P, Zhou J C, Wang X R, et al. Economic and environmental evaluation on model for describing crop yield response to nitrogen fertilizer at winter-wheat and summer-corn rotation system[J]. Acta Pedologica Sinica, 2000, 37(3): 346-353. DOI: 10.3321/j.issn:0564-3929.2000.03.008
[12] 杨守春, 孙昭荣, 刘秀奇. 黄淮海平原不同土壤小麦氮、磷最佳用量的研究[J]. 土壤肥料, 1988, (1): 1-5. Yang S C, Sun Z R, Liu X Q. Study on the optimum amount of nitrogen and phosphorus for wheat in different soils in Huang-Huai-Hai Plain[J]. Soil and Fertilizer, 1988, (1): 1-5.
[13] 周竹叶. 我国化肥工业概况与发展趋势[J]. 磷肥与复肥, 2019, 34(10): 1-4. DOI: 10.3969/j.issn.1007-6220.2019.10.002 Zhou Z Y. General situation and development trend of chemical fertilizer industry in China[J]. Phosphorus and Compound Fertilizer, 2019, 34(10): 1-4. DOI: 10.3969/j.issn.1007-6220.2019.10.002
[14] 朱彦锋, 刘建玲, 赵营. 河北省冬小麦专用肥配方优化研究[J]. 宁夏农林科技, 2018, 59(4): 15-18, 26. DOI: 10.3969/j.issn.1002-204X.2018.04.005 Zhu Y F, Liu J L, Zhao Y. Study on the formula optimization of winter wheat special fertilizer in Hebei Province[J]. Ningxia Agricultural and Forestry Science and Technology, 2018, 59 (4): 15-18, 26. DOI: 10.3969/j.issn.1002-204X.2018.04.005
[15] 车升国. 区域作物专用复合(混)肥料配方制定方法与应用[D]. 北京: 中国农业大学博士学位, 2015. Che S G. Formulation method and application of regional crop specific compound (mixed) fertilizer[D]. Beijing: PhD Dissertation of China Agricultural University, 2015.
[16] 吴良泉. 基于“大配方、小调整”的中国三大粮食作物区域配肥技术研究[D]. 北京: 中国农业大学博士学位论文, 2014. Wu L Q. Study on regional fertilization technology of three major grain crops in China based on “large formula and small adjustment”[D]. Beijing: PhD Dissertation of China Agricultural University, 2014.
[17] 徐新朋. 基于产量反应和农学效率的水稻和玉米推荐施肥方法研究[D]. 北京: 中国农业科学院硕士学位论文, 2015. Xu X P. Study on recommended fertilization methods for rice and maize based on yield response and agronomic efficiency[D]. Beijing: MS Thesis of Chinese Academy of Agricultural Sciences, 2015.
[18] 孙义祥, 郭跃升, 于舜章, 等. 应用“3414”试验建立冬小麦测土配方施肥指标体系[J]. 植物营养与肥料学报, 2009, 15(1): 197-203. DOI: 10.3321/j.issn:1008-505X.2009.01.029 Sun Y X, Guo Y S, Yu S Z, et al. Establishing phosphorus and potassium fertilization recommendation index based on the “3414” field experiment[J]. Journal of Plant Nutrition and Fertilizers, 2009, 15(1): 197-203. DOI: 10.3321/j.issn:1008-505X.2009.01.029
[19] 王乐, 张淑香, 马常宝, 等. 潮土区29年来土壤肥力和作物产量演变特征[J]. 植物营养与肥料学报, 2018, 24(6): 1435-1444. DOI: 10.11674/zwyf.18187 Wang L, Zhang S X, Ma C B, et al. Evolution characteristics of soil fertility and crop yield in tidal soil area in 29 years[J]. Journal of Plant Nutrition and Fertilizers, 2018, 24 (6): 1435-1444. DOI: 10.11674/zwyf.18187
[20] 谭德永, 金继运, 黄绍文, 等. 不同种植制度下长期施钾与秸秆还田对作物产量和土壤钾素的影响[J]. 中国农业科学, 2007, 40(1): 133-139. DOI: 10.3321/j.issn:0578-1752.2007.01.018 Tan D Y, Jin J Y, Huang S W, et al. Effect of long-term application of K fertilizer and wheat straw to soil on crop yield and soil K under different planting system[J]. Scientia Agricultura Sinica, 2007, 40(1): 133-139. DOI: 10.3321/j.issn:0578-1752.2007.01.018
[21] 孔宏敏, 何圆球, 吴大付, 等. 长期施肥对红壤旱地作物产量和土壤肥力的影响[J]. 应用生态学报, 2004, 15(5): 782-786. DOI: 10.3321/j.issn:1001-9332.2004.05.010 Kong H M, He Y Q, Wu D F, et al. Effect of long term fertilizer on crop yield and soil fertility of upland red soil[J]. Chinese Journal of Applied Ecology, 2004, 15(5): 782-786. DOI: 10.3321/j.issn:1001-9332.2004.05.010
[22] 张福锁, 王激清, 张卫峰, 等. 中国主要粮食作物肥料利用率现状与提高途径[J]. 土壤学报, 2008, 45(5): 916-924. Zhang F S, Wang J Q, Zhang W F, et al. Nutrient use efficiencies of major cereal crops in China and measures for improvement[J]. Acta Pedologica Snica, 2008, 45(5): 916-924.
[23] 闫湘, 金继运, 何萍, 等. 提高肥料利用率技术研究进展[J]. 中国农业科学, 2008, 41(2): 450-459. DOI: 10.3864/j.issn.0578-1752.2008.02.019 Yan X, Jin J Y, He P, et al. Recent advances and prospects on the technology to increase fertilizer use efficiency[J]. Scientia Agricultura Sinica, 2008, 41(2): 450-459. DOI: 10.3864/j.issn.0578-1752.2008.02.019
[24] 朱兆良. 推荐氮肥适宜施用量的方法论刍议[J]. 植物营养与肥料学报, 2006, 12(1): 1-4. DOI: 10.3321/j.issn:1008-505X.2006.01.001 Zhu Z L. On the methodology of recommendation for the application rate of chemical fertilizer nitrogen to crops[J]. Journal of Plant Nutrition and Fertilizers, 2006, 12(1): 1-4. DOI: 10.3321/j.issn:1008-505X.2006.01.001
[25] 付文, 黄玉芳, 岳松华, 等. “大配方, 小调整”施肥模式对不同地力小麦产量及经济效益的影响[J]. 中国土壤与肥料, 2019, (6): 235-240. Fu W, Huang Y F, Yue S H, et al. Effect of“regional fertilizer formula and site specific adjustment” fertilization mode on yield and economic benefit of wheat under soils with different fertilities[J]. Soil and Fertilizer Sciences in China, 2019, (6): 235-240.
[26] 吴良泉, 武良, 崔振岭, 陈新平. 中国小麦区域氮磷钾肥推荐用量及肥料配方研究[J]. 中国农业大学学报, 2019, 24(11): 30-40. DOI: 10.11841/j.issn.1007-4333.2019.11.04 Wu L Q, Wu L, Cui Z L, et al. Optimal regional nitrogen, phosphorus, potassium rates recommendations and special fertilizer formulae study for wheat in China[J]. Journal of China Agricultural University, 2019, 24(11): 30-40. DOI: 10.11841/j.issn.1007-4333.2019.11.04
[27] 农业部办公厅. 《小麦、玉米、水稻三大粮食作物区域大配方与施肥建议(2013)》的通知[DB/OL]. http://www.moa.gov.cn/nybgb/2013/dbaq/201712/t20171219_6119839.htm. The Ministry of Agriculture of the People's Republic of China. Notice on regional large formula and fertilizer recommendation of wheat, corn and rice (2013) [DB/OL]. http://www.moa.gov.cn/nybgb/2013/dbaq/201712/t20171219_6119839.htm.
-
期刊类型引用(9)
1. 刘秀秀,陈惠华,陈露婷,胡侠君,徐鹏,李振宏,朱新开. 淮北地区小麦缓释肥的应用效果及减施增效技术. 耕作与栽培. 2024(06): 102-107 .  百度学术
百度学术
2. 徐新朋,串丽敏,何萍,周卫. 基于产量反应和农学效率的小麦智能化推荐施肥方法研究. 植物营养与肥料学报. 2023(07): 1190-1201 . 本站查看
3. 施卫明,王远,闵炬. 中国农业面源污染防控研究进展与工程案例. 土壤学报. 2023(05): 1309-1323 . 百度学术
4. 李鑫格,高杨,刘小军,田永超,朱艳,曹卫星,曹强. 播期播量及施氮量对冬小麦生长及光谱指标的影响. 作物学报. 2022(04): 975-987 . 百度学术
5. 郭丹丹,刘哲文,常旭虹,王德梅,王艳杰,杨玉双,王玉娇,石书兵,赵广才. 不同氮磷钾肥处理对小麦产量和品质的影响. 农业科技通讯. 2022(03): 47-52 . 百度学术
6. 李怀胜,张磊. 氮·磷减施对滴灌春小麦干物质积累和产量的影响. 安徽农业科学. 2022(12): 141-145 . 百度学术
7. 刘建玲,吴晶,贾可,廖文华,吕英华,马俊永. 冬小麦-夏玉米轮作区土壤磷与磷肥产量效应变化. 华北农学报. 2022(03): 104-111 . 百度学术
8. 葛晓梅. 小麦高产土壤肥料管理技术分析. 农家参谋. 2022(14): 10-12 . 百度学术
9. 孙霞霞. 北方冬小麦高产栽培技术认识实践. 南方农业. 2021(17): 25-26 . 百度学术
其他类型引用(11)
计量
- 文章访问数: 2108
- HTML全文浏览量: 929
- PDF下载量: 111
- 被引次数: 20
